Smart Plot Command

Command Description
Provides a quick and easy way to generate high quality drawings from the TBC Plan and Profile Views, using inbuilt drafting templates (Title Boxes & Borders).
Command Location
The Smart Plot Command is licensed to the Smart Suite Command Library only
- The command is located on the Smart Suite Menu
- The command is located in the Drafting Group on the Smart Suite Menu
- The command is also located in the Drafting Group on the Reporting Menu
Release History
v1.0 released Dec 2025 with RPS Command Library v2025.4
Video Demonstration
The following video provides a quick overview of the Smart Plot Command
The following video shows you how to use the Smart Plot command.
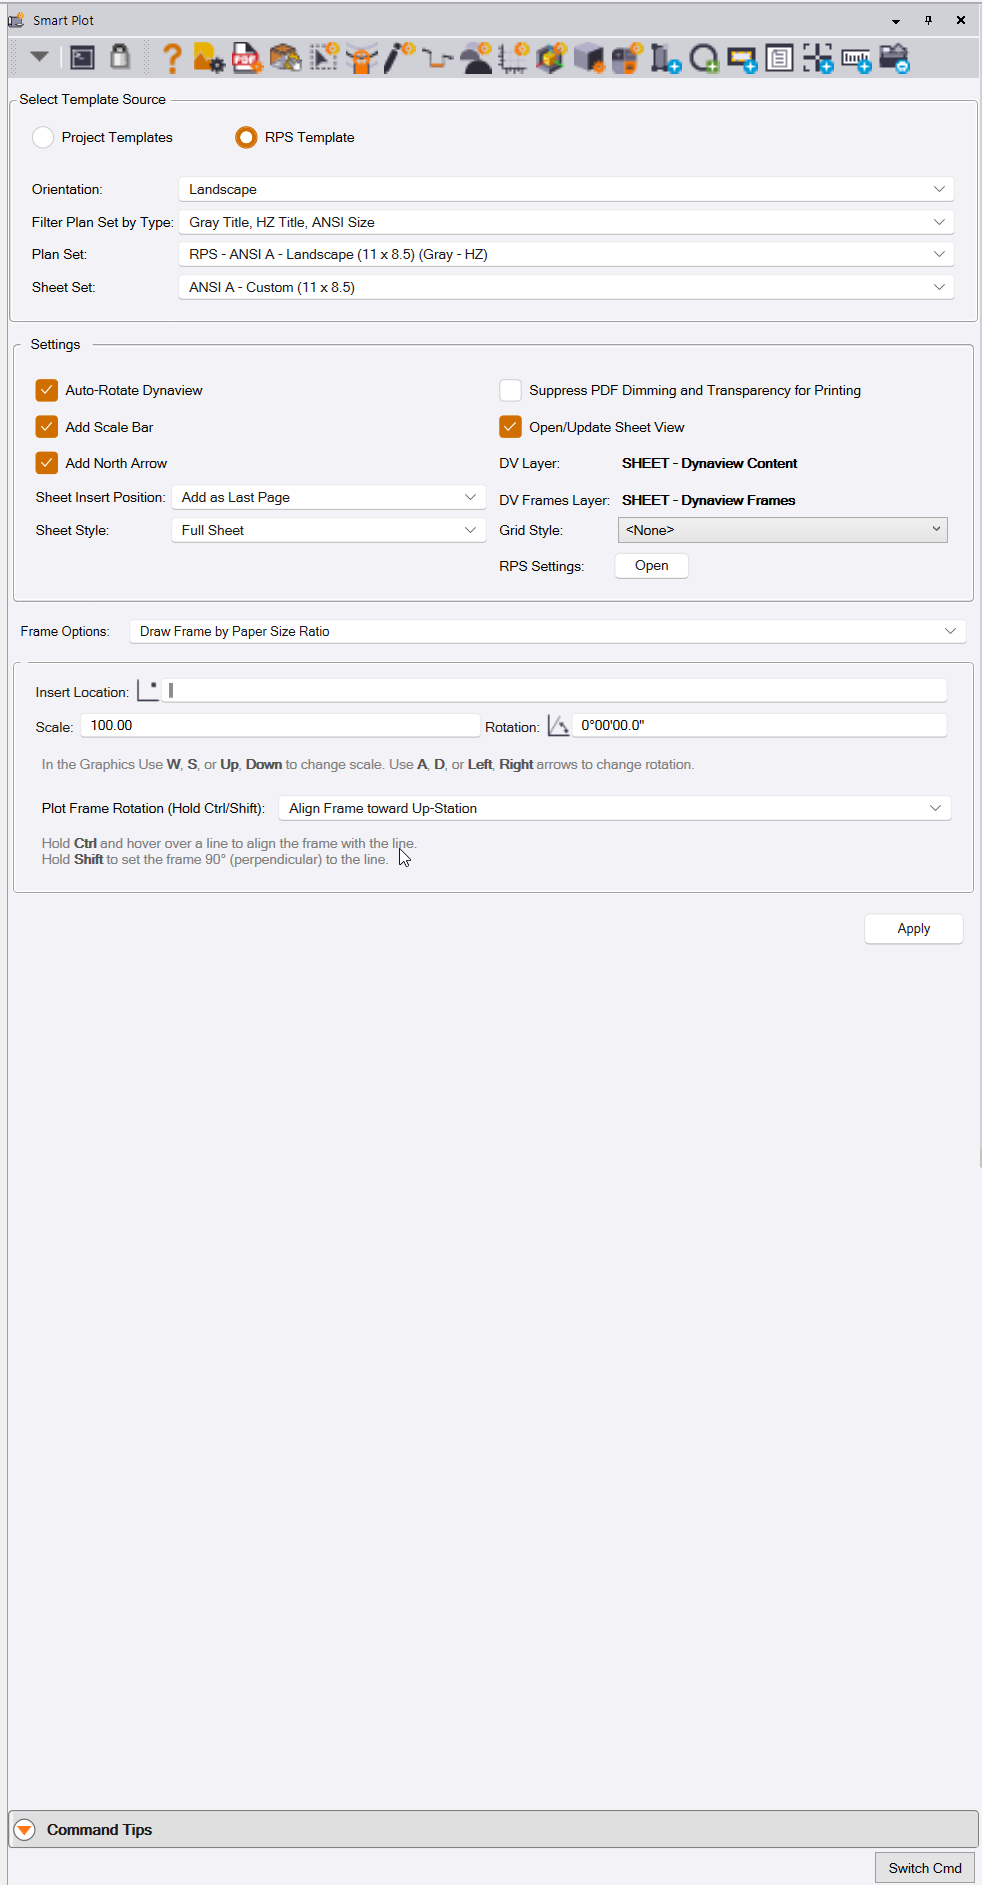
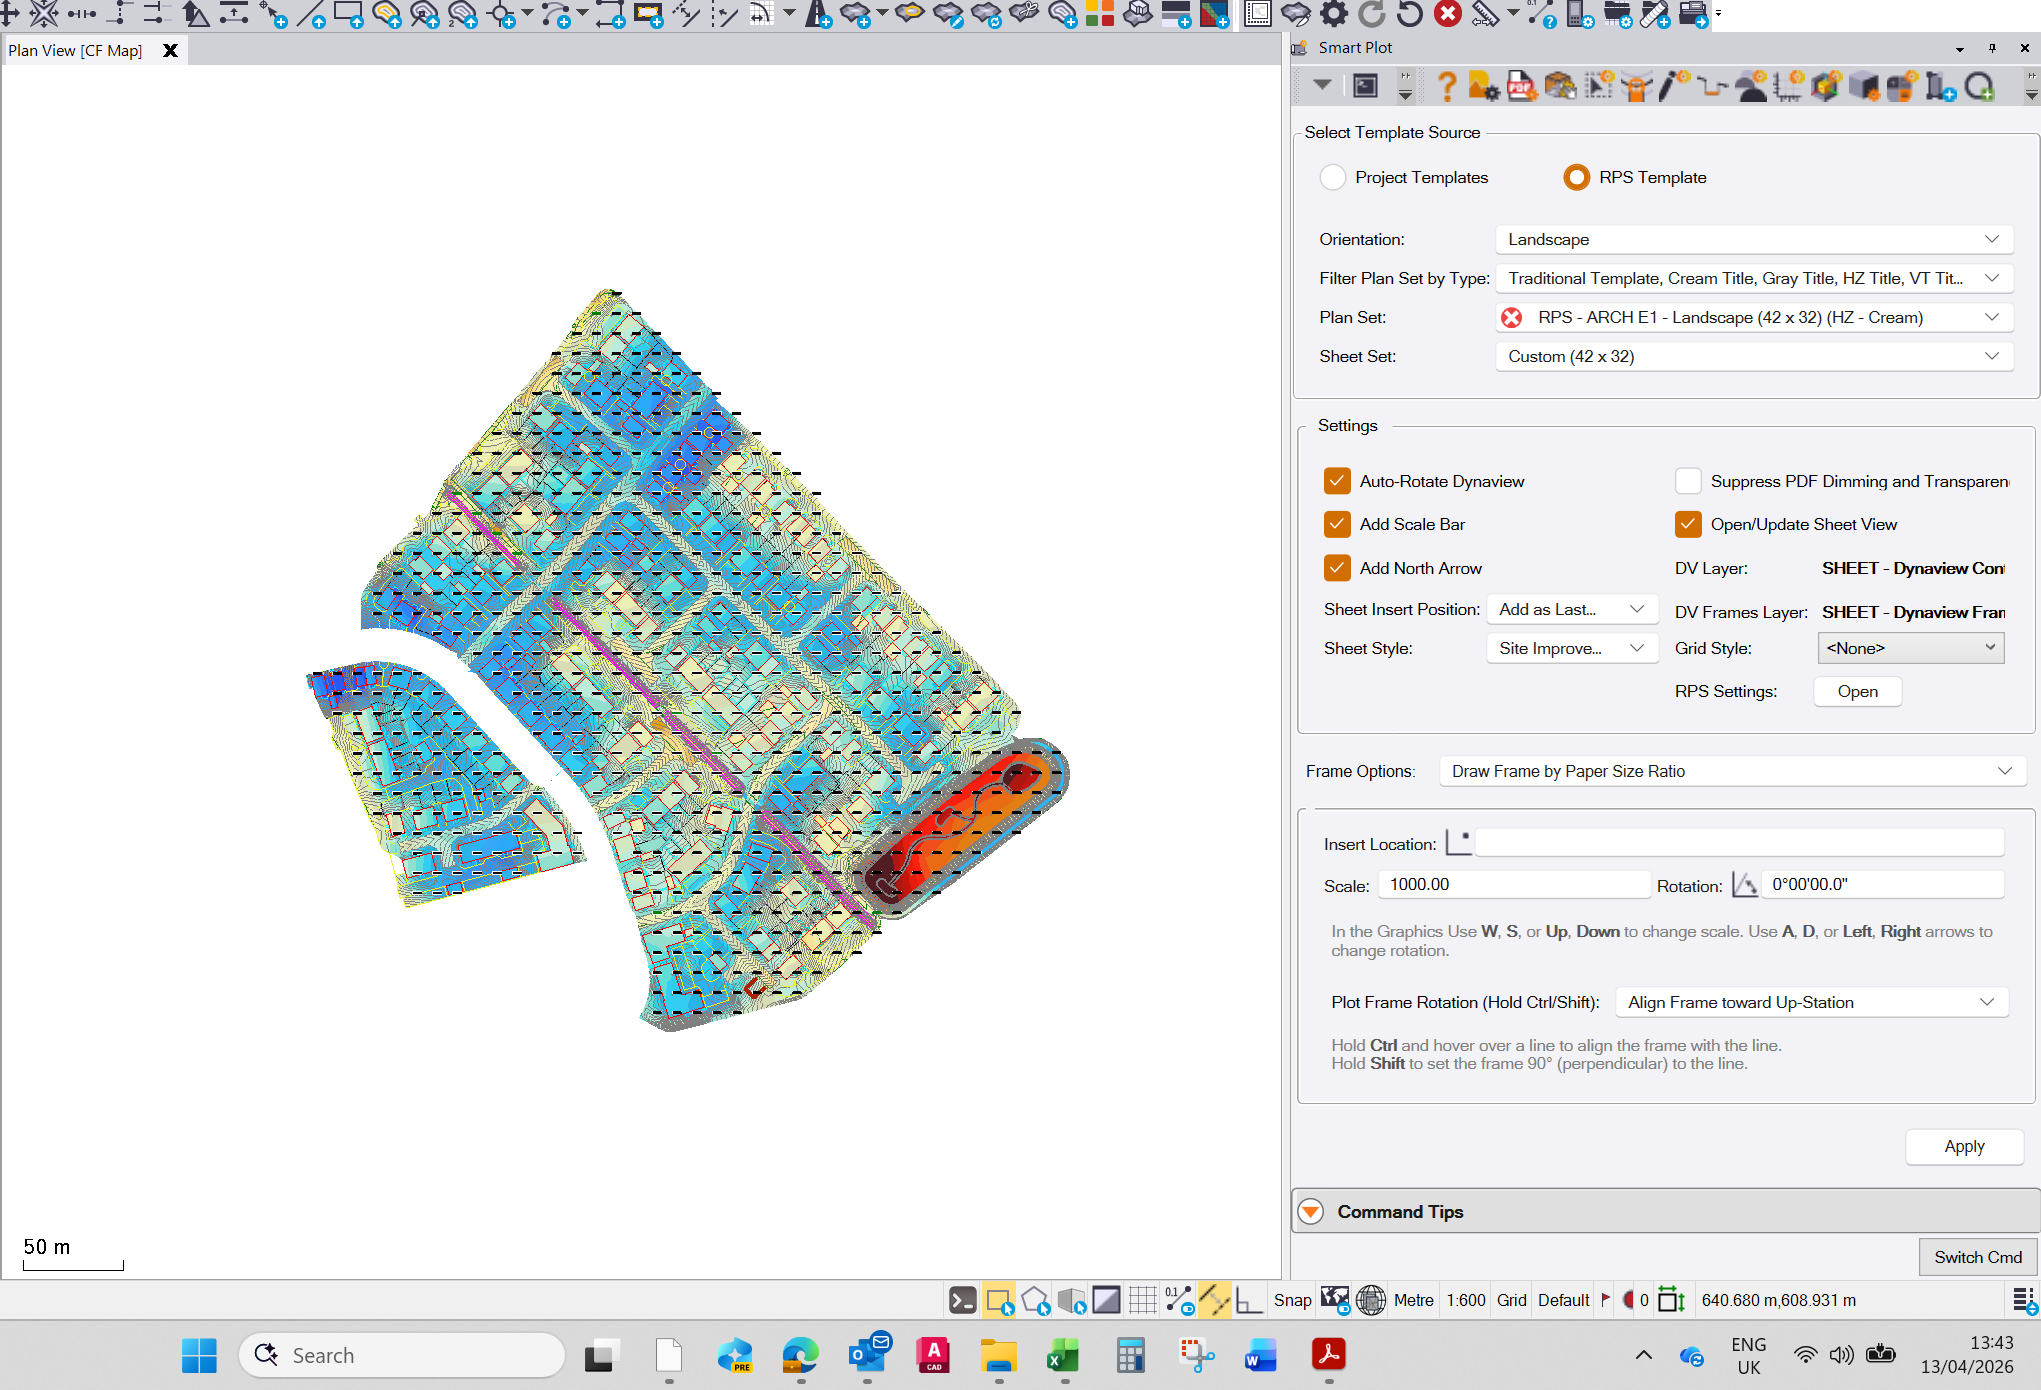
Select Template Source
RPS Command Library installs a set of drawing sheet templates that you can use (RPS Template) or you can select to use a drawing template of your own that already exists in your project (Project Templates). Select the radio button for the one that you wish to use.
When using the RPS Templates, these support all US Paper Sizes for ANSI and ARCH definitions in both Portrait and Landscape modes. You can select Portrait or Landscape mode to filter the list of available templates.
The RPS Templates also provide both horizontal and vertical title box options.
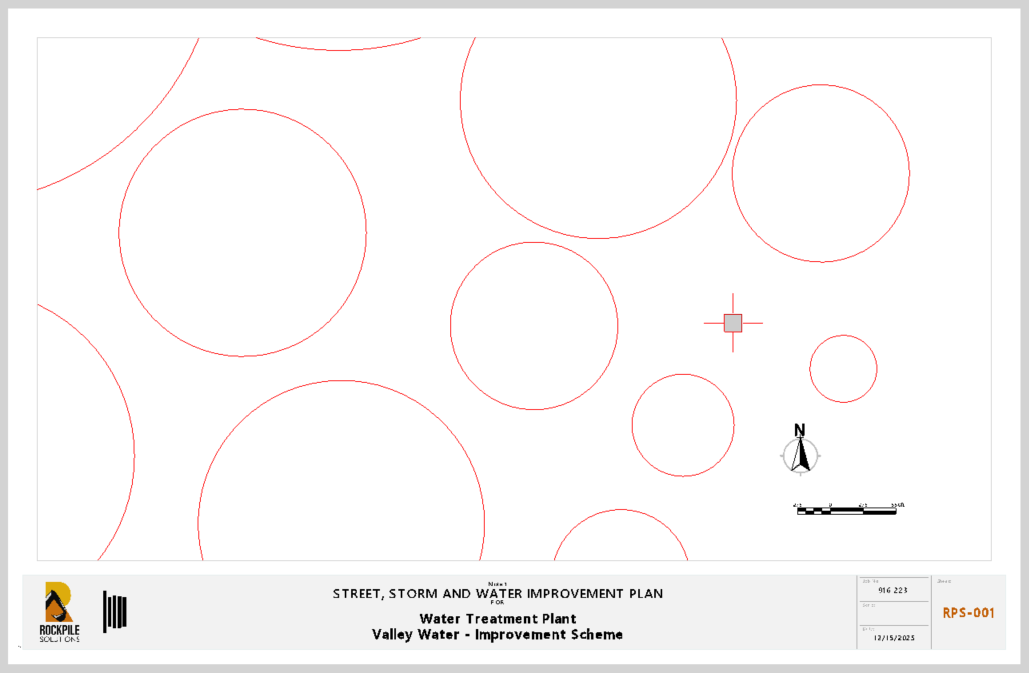
The RPS Templates provide 3 variants of a drawing template as shown below
Traditional
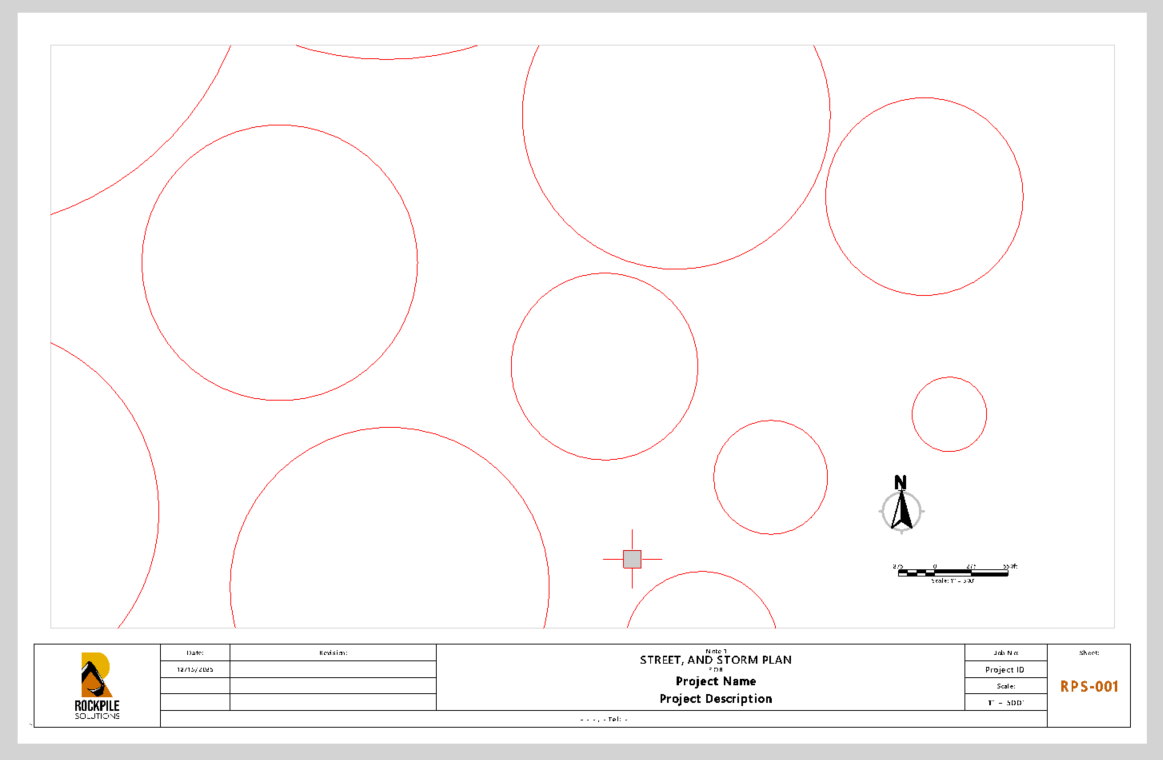
Cream
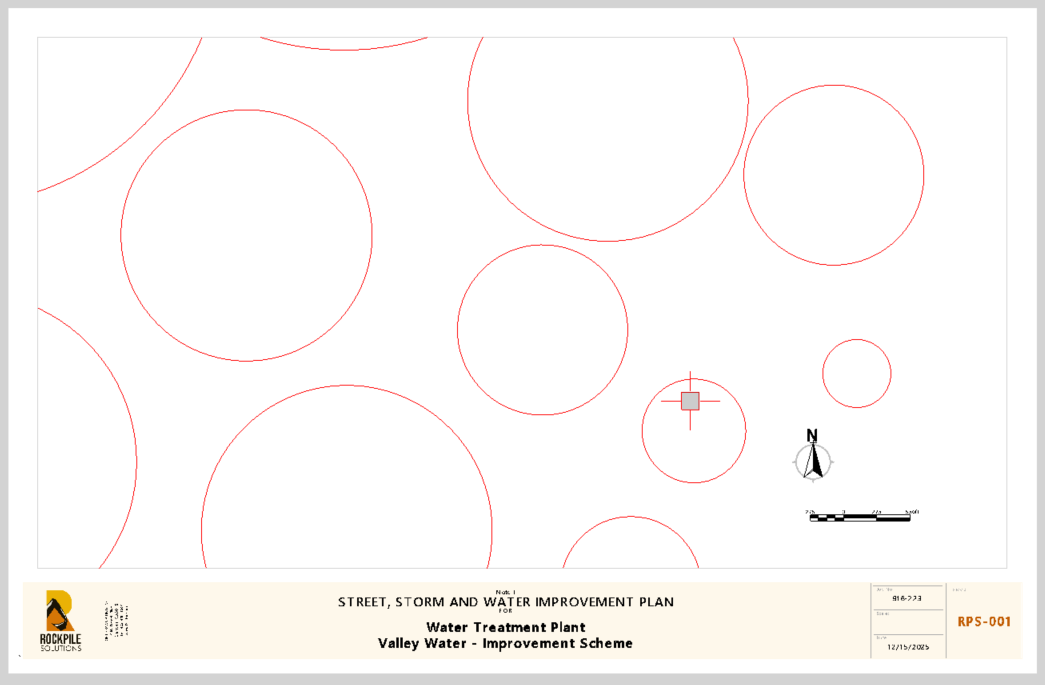
Gray
The RPS Templates are stored in the RPS Settings folder, in a sub folder called RPS Smart Plot/Templates/ followed by feet or Metric and then Portrait or Landscape sub folders. They are stored as VCL files created with the 2024.xx version of TBC. If you are running an older version of TBC, the files will need to be downgraded before using them in an older version of TBC. Call RPS Support for assistance if needed.
Orientation
Select the sheet orientation that you wish to use for your project, the options are portrait or Landscape orientation.
Filter Plan Set by Type
In this pull down you can set filter controls to minmize the list o template types offered to you in the Plan Set pull down. The filters you can use include
Template Styles - Traditional, Gray or Cream
Title Box Style - HZ (Horizontal - Bottom) or VT (Vertical - Right Side)
Paper Sizes - ANSI (A to E), ARCH (A to E)
Select as many of the options as you feel that you may need to use.
Plan Set
Select the Plan Set style that you would like to use - this defines the paper size, template style, and title box style e.g. RPS - ANSI B - Landscape (17 x 11) (HZ - Gray). On selecting the Plan Set the Sheet Set is set automatically. You will be able to find the Plan Set, Sheet Set and created Sheets in the Project Explorer, under the Plan Sets section.
Sheet Set
The Sheet Set is created automatically under the selected Plan Set. The Sheets that you create using this template wil be created within the Sheet Set.
TBC Plan Set Structure - Background Information
TBC Drawing Creation
TBC stores drawing sheets in a hierarchy of
Plan Set
Sheet Set
Sheet
If you put this in context of a PDF Plan Set that you may receive from an Engineer for a project, the PDF File is the Plan Set, The Grading Plans, Erosion Control Plans, or Plan and Profile Sheets are Sheet Sets, and the individual pages of drawings within those groups are the Sheets.
When using Smart Plot, you will be creating Single Sheets of type “Custom Sheet” that reside within the selected Plan Set and Sheet Set.
Anything that is drawn at the Plan Set level will appear on every Sheet in every Sheet Set under the Plan Set.
Anything that is drawn at the Sheet Set level will appear on every Sheet of that Sheet Set only
Anything that is drawn at the Sheet level, will only appear on that individual Sheet.
Dynaviews
TBC creates what it calls a Dynaview on a drawing sheet that reflects the content of a dynaview frame that is selected in the Plan or Profile View. The Dynaview Frame is created automatically by the Smart Plot process, but you can also use any closed shape as a frame to create a Dynaview i.e. Circle, Rectangle. Polygon, Closed Polyline, Closed Linestring, Boundary etc. We place the Dynaview Frames automatically on the SHEET - Dynaview Frames layer.
The Dynaview that is placed on the Sheet in the Sheet view is automaticaly placed on the SHEET - Dynaview Content layer. This allows you to display the content without also displaying the frame used to create the Dynaview, the SHEET - Dynaview Frames layer can be turned off in your View Filter that you are using to control the content of the Dynaview on the Sheet.
The Dynaview is scaled when it is placed on the drawing sheet (Smart Plot determines the scale or you can define the scale yourself).
The Dynaview content is controlled by a View Filter that is applied to the Dynaview in the Sheet View. You can change the View Filter applied to any Dynaview by selecting the Dynaview on the drawing sheet in the TBC Sheet View, and mdifying the View Filter property in the TBC Properties Pane.
The Dynaview Frame that is placed in the Plan or Profile View can be moved or resized, and when it is modified, the content of the Dynaview on the Sheet in Sheet View will update automatically to reflect the content of the new frames position and size / shape. There are limits to the resizing, if you make the frame too large, it will no longer fit in the availavble space on the Sheet in Sheet View.
Sheet Annotation
Once created, the Sheet and its related Dynaviews, can be anotated in the Sheet View on the Sheet itself as necessary. If you wish to add Dimensions or Labels that use Smart Text that are dependent on the objects that are displayed in the Dynaview, it is better to make those additions in the Plan View or Profile View. If you wish to just add some text to explain a drawing or result, or simply to give a drawing a title, then that can be drawn and placed in the Sheet View.
Opening a Drawing Sheet in Sheet View
To open a Drawing Sheet, go to Project Explorer, locate the section called Plan Sets, Find Your Plan Set, Sheet Set and Sheet, right click the Sheet and select - New Sheet View to open a view that displays the drawing sheet. Once in the Sheet View, at the base of the view there is a sheet selector that allows you to pull up a list of all sheets and select the sheet that you want to view. You can also use the Up and Down arrow keys to navigate up or down the sheet list once the sheet selector field has been highlighted (click in the selector field to highlight it).
In the Sheet Selector Area of the Sheet View you will also find a print Plan Set button, this will open the Print Plan Set command that allows you to send the sheets to a printer or capture the sheets in a PDF file output.
The standard RPS Layers that define where the Dynaview Frames and Dynaview Content are stored, along with all other settings used by the Smart Plot command can be found in RPS Settings - Smart Plot (see below).
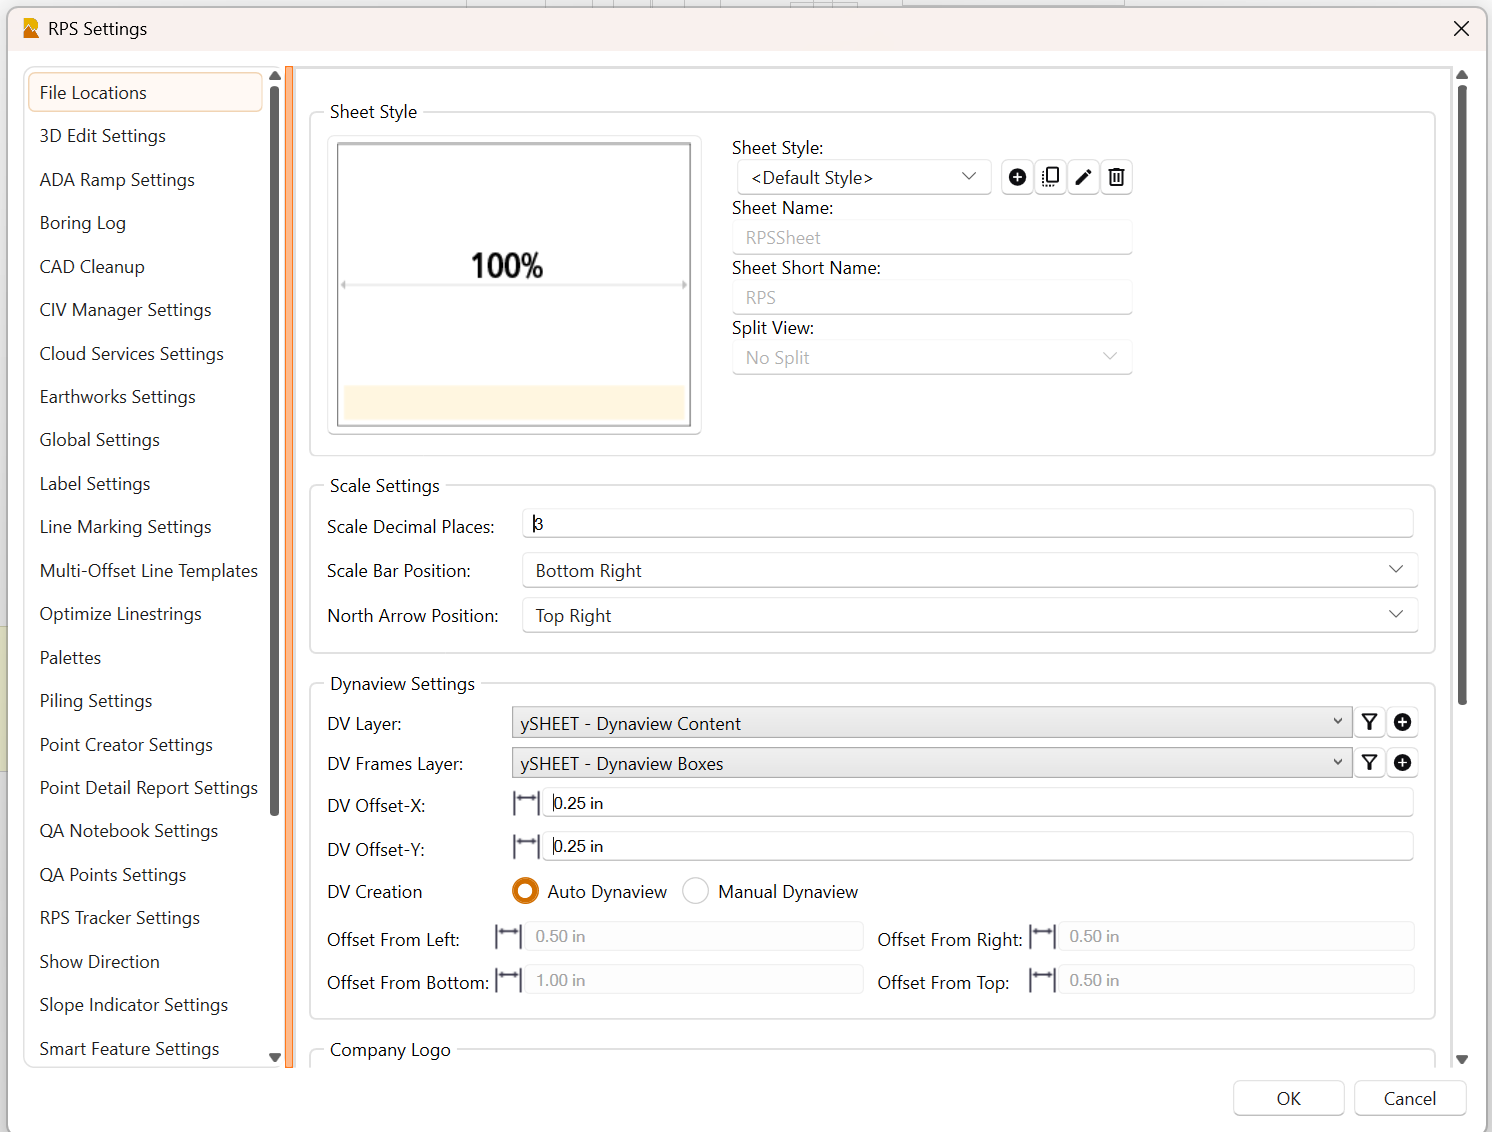
RPS Settings
The settings that control the Smart Plot capabilities can be found in RPS Settings - Smart Plot. The RPS Settings command can be found in the header Bar icons of the Smart Plot command or on the RPS Support Menu - Core Group.
The RPS Settings command dialog for Smart Plot looks as follows
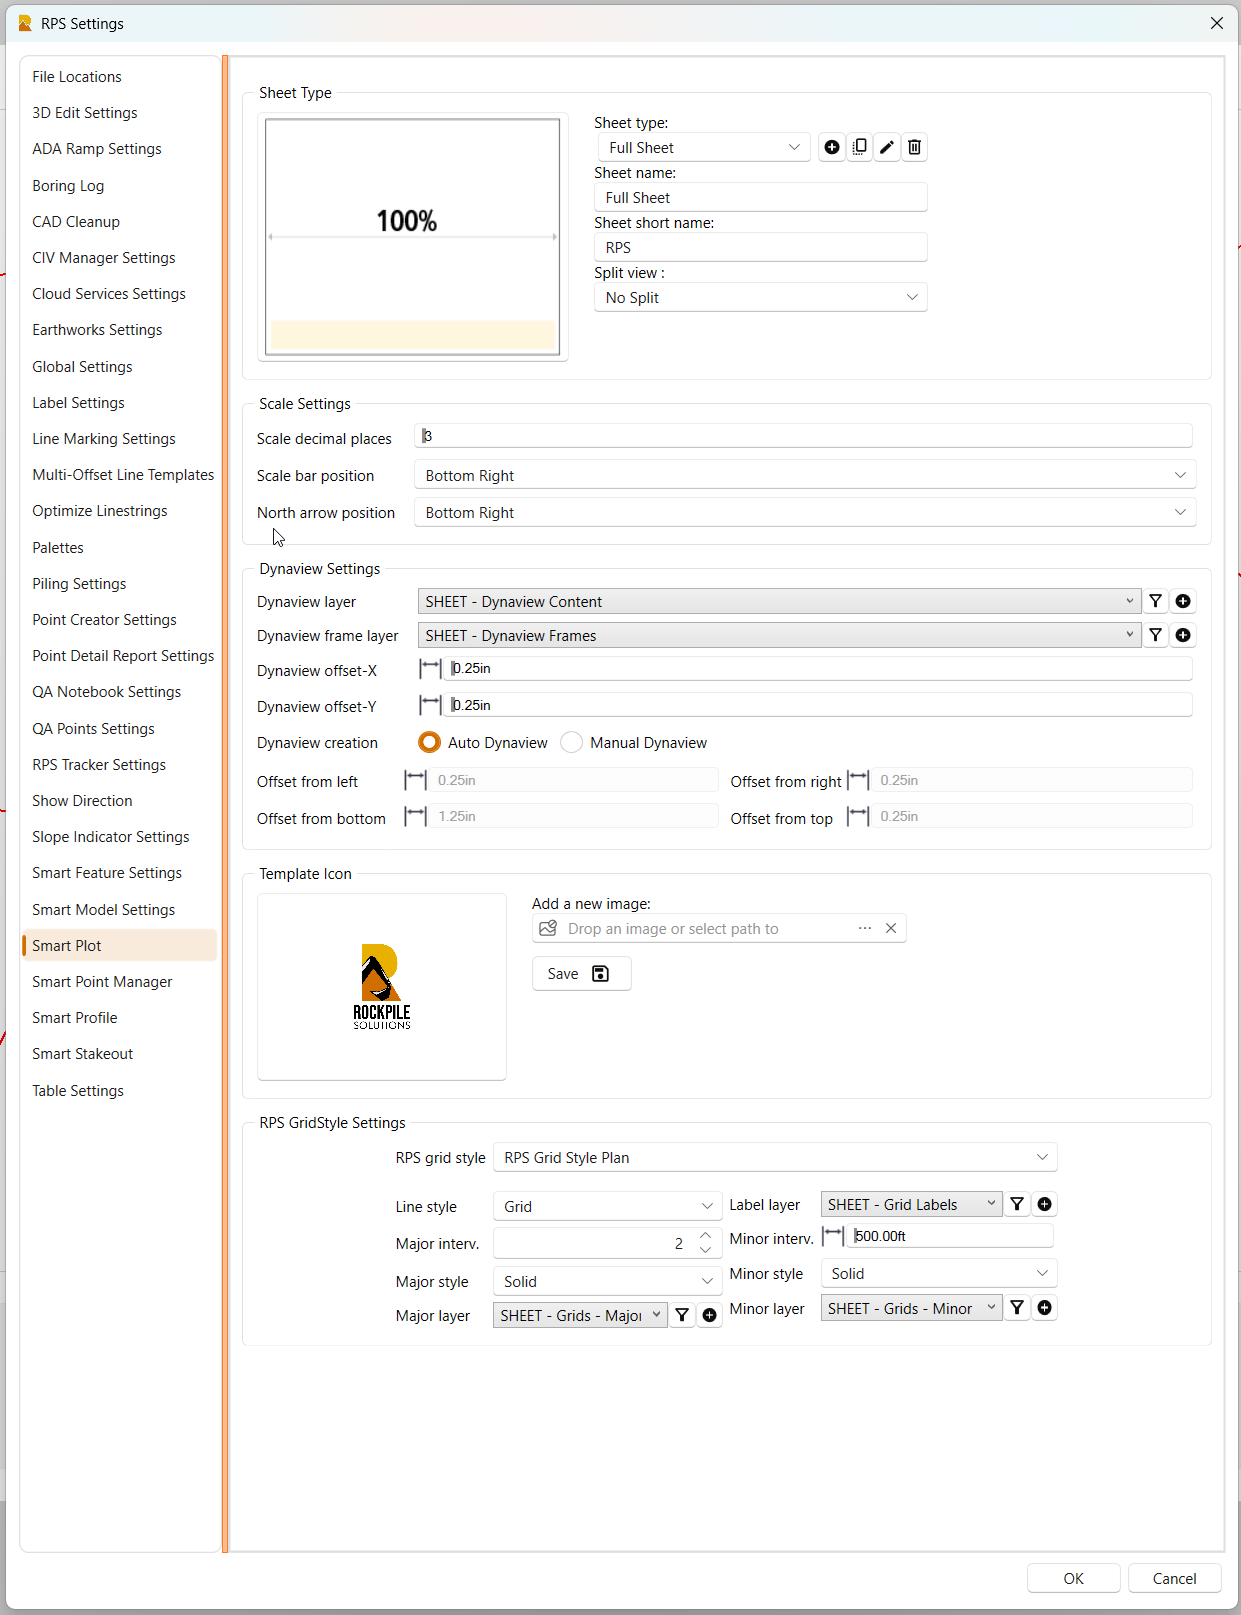
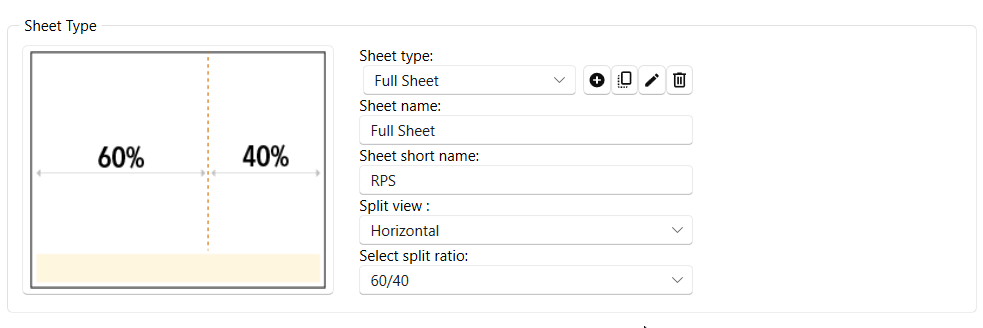
Sheet Type
In addition to the drawing template styles which define the overall layout o the drawing sheet and title box, the Sheet Type settings allow you to define how you want to use the available drawing space on the sheet. For example you may want to use the full drawing area to layout a single dynaview that fills the available space. Alternatively, you may want the site plan or cut fill map to fill only 60% of the available width of the space (horizontally (Landscape) or vertically (Portrait)) so as to reserve space for a 3D view image and a Cut Fill Quantity Report etc. The following setings, control this process.
Sheet Type
You can Add, Copy, Edit or Delete a Sheet Type. The Sheet Type is a name, the following settings control how that Sheet Type performs.
Sheet Name
When you create a Sheet Type, you give the Sheet Type a Name and that is displayed in this field.
Sheet Short Name
The Sheet Type has a Short Name. The Short Name becomes the prefix for the Sheet Numbers that are automatically assigned to the Sheet in the Title Box area. for example if the short name is RPS then the first sheet of that type in the Sheet Set will be RPS-001. keep the Short Names short, we recommend the use of 3 characters e.g. GDG for Grading, ERS for Erosion Control, PRF for Profiles etc.
Split View
The drawing pane can be used at 100% for a Dynaview (No Split), it can be split Horizontally (Horizontal) or Vertically (Vertical). When you select either Horizontal or Vertical, you will be asked for the Split Ratio. The Split Ratio options are 100/0, 50/50, 60/40, 70/30 or 80/20. The larger number is always the Left pane or the Upper Pane of the two panes that are created. the larger number is allways the pane that uis used for the Dynaview that is being created.
Scale Settings
The Smart Plot command in some methods derives its own scale for a drawing. This will mean that the derived scale is not a nice round scale like 1”=50’. In these cases the scale may be 1”=63.875674’ for example. In these scenarios you can define the number of ecimal places that you wish to display on the draing scalebar that is created automatically. Note if you display with no decimal places, the scale value displayed will not accurately reflect the scale that is actually in use.
Scale Bar Position
Select where in the placed Dynaview you would like the automatically created scale bar placed. You can place at the Top or Bottom of the Dynaview and on the Left, Center or Right of the Dynaview.
North Arrow Position
Select where in the placed Dynaview you would like the automatically created North Arrow placed. You can place at the Top or Bottom of the Dynaview and on the Left, Center or Right of the Dynaview.
Dynaview Settings
Dynaview Layer
Select the layer onto which you want to place the Dynaviews in the Sheet View on the darwing sheets. The RPS default is SHEET - Dynaview Content
Dynaview Frame Layer
Select the layer onto which you want to place the Dynaview Frames in the Plan or Profile View. The RPS default is SHEET - Dynaview Frames.
Placing the Dynaview on The Sheet
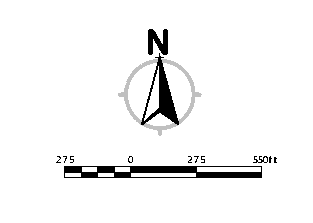
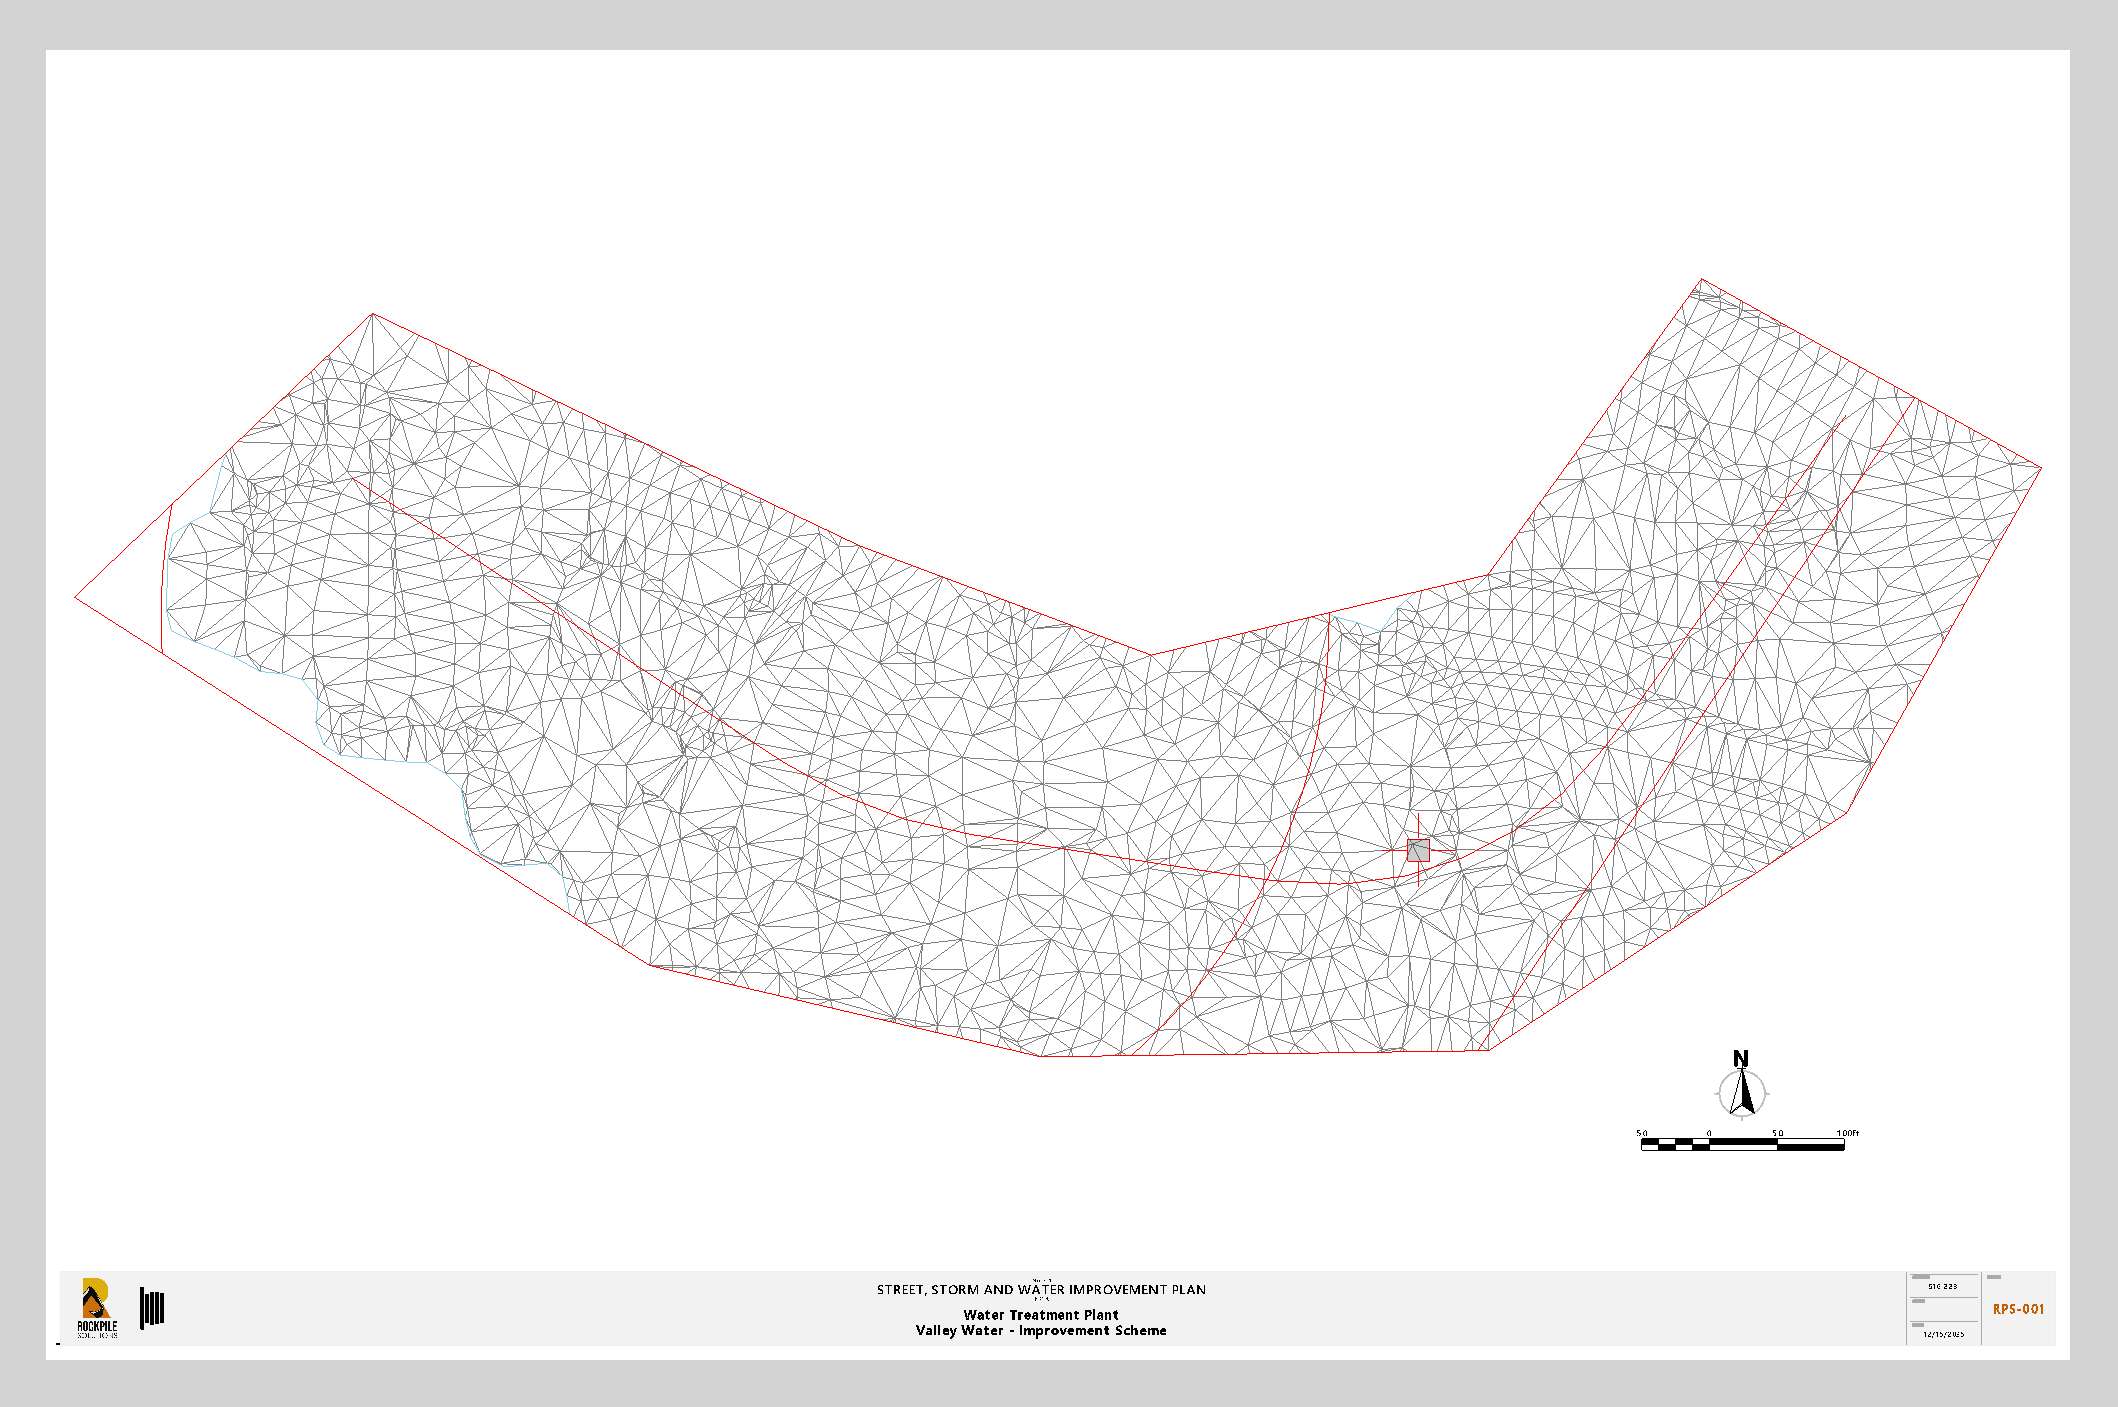
The grey area in the image below is the available drawing space on the Sheet
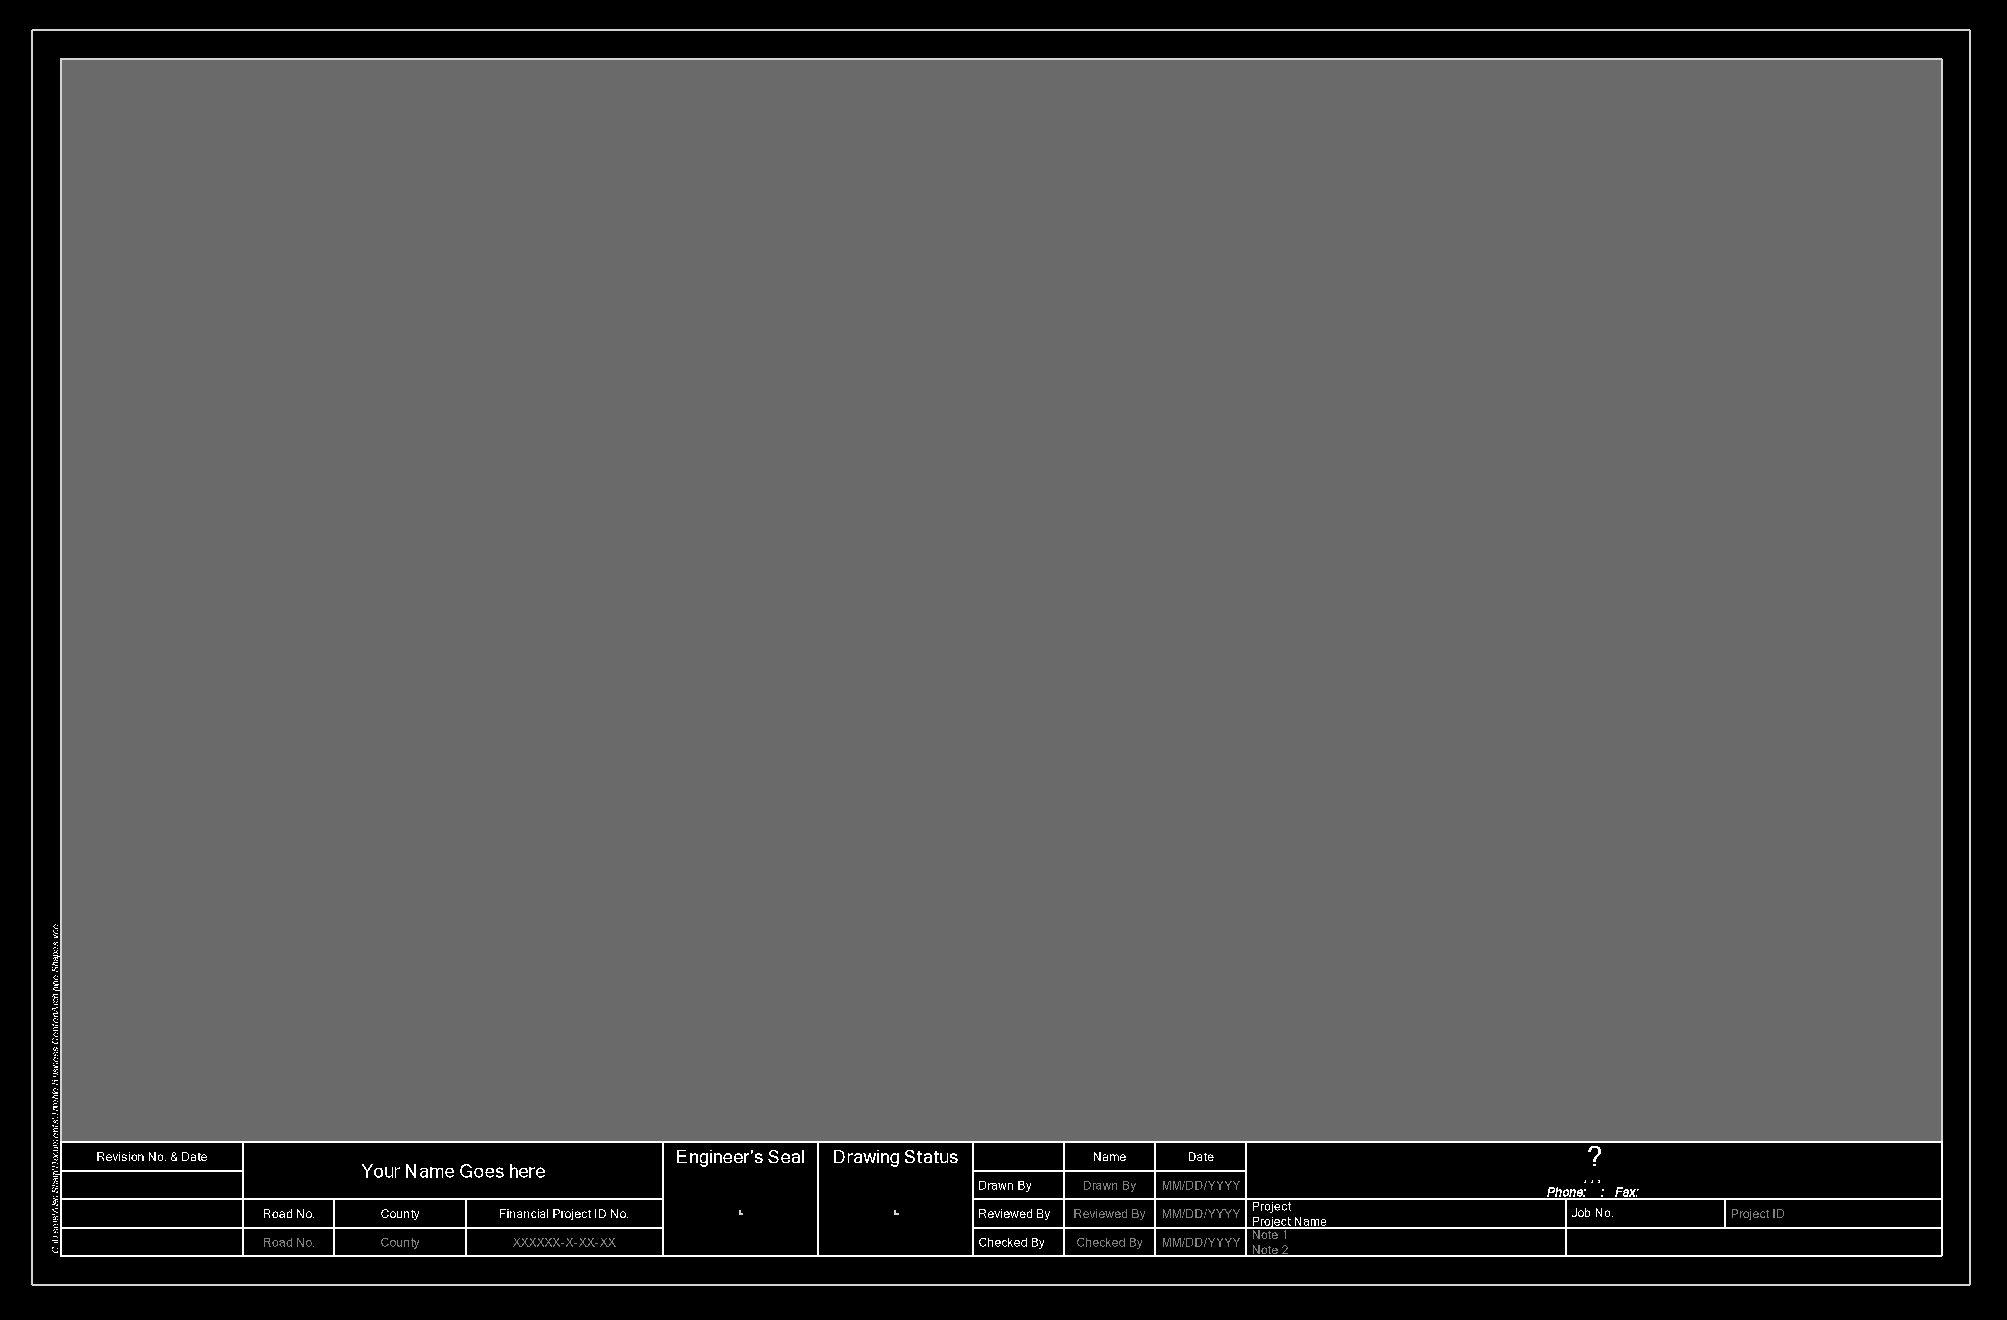
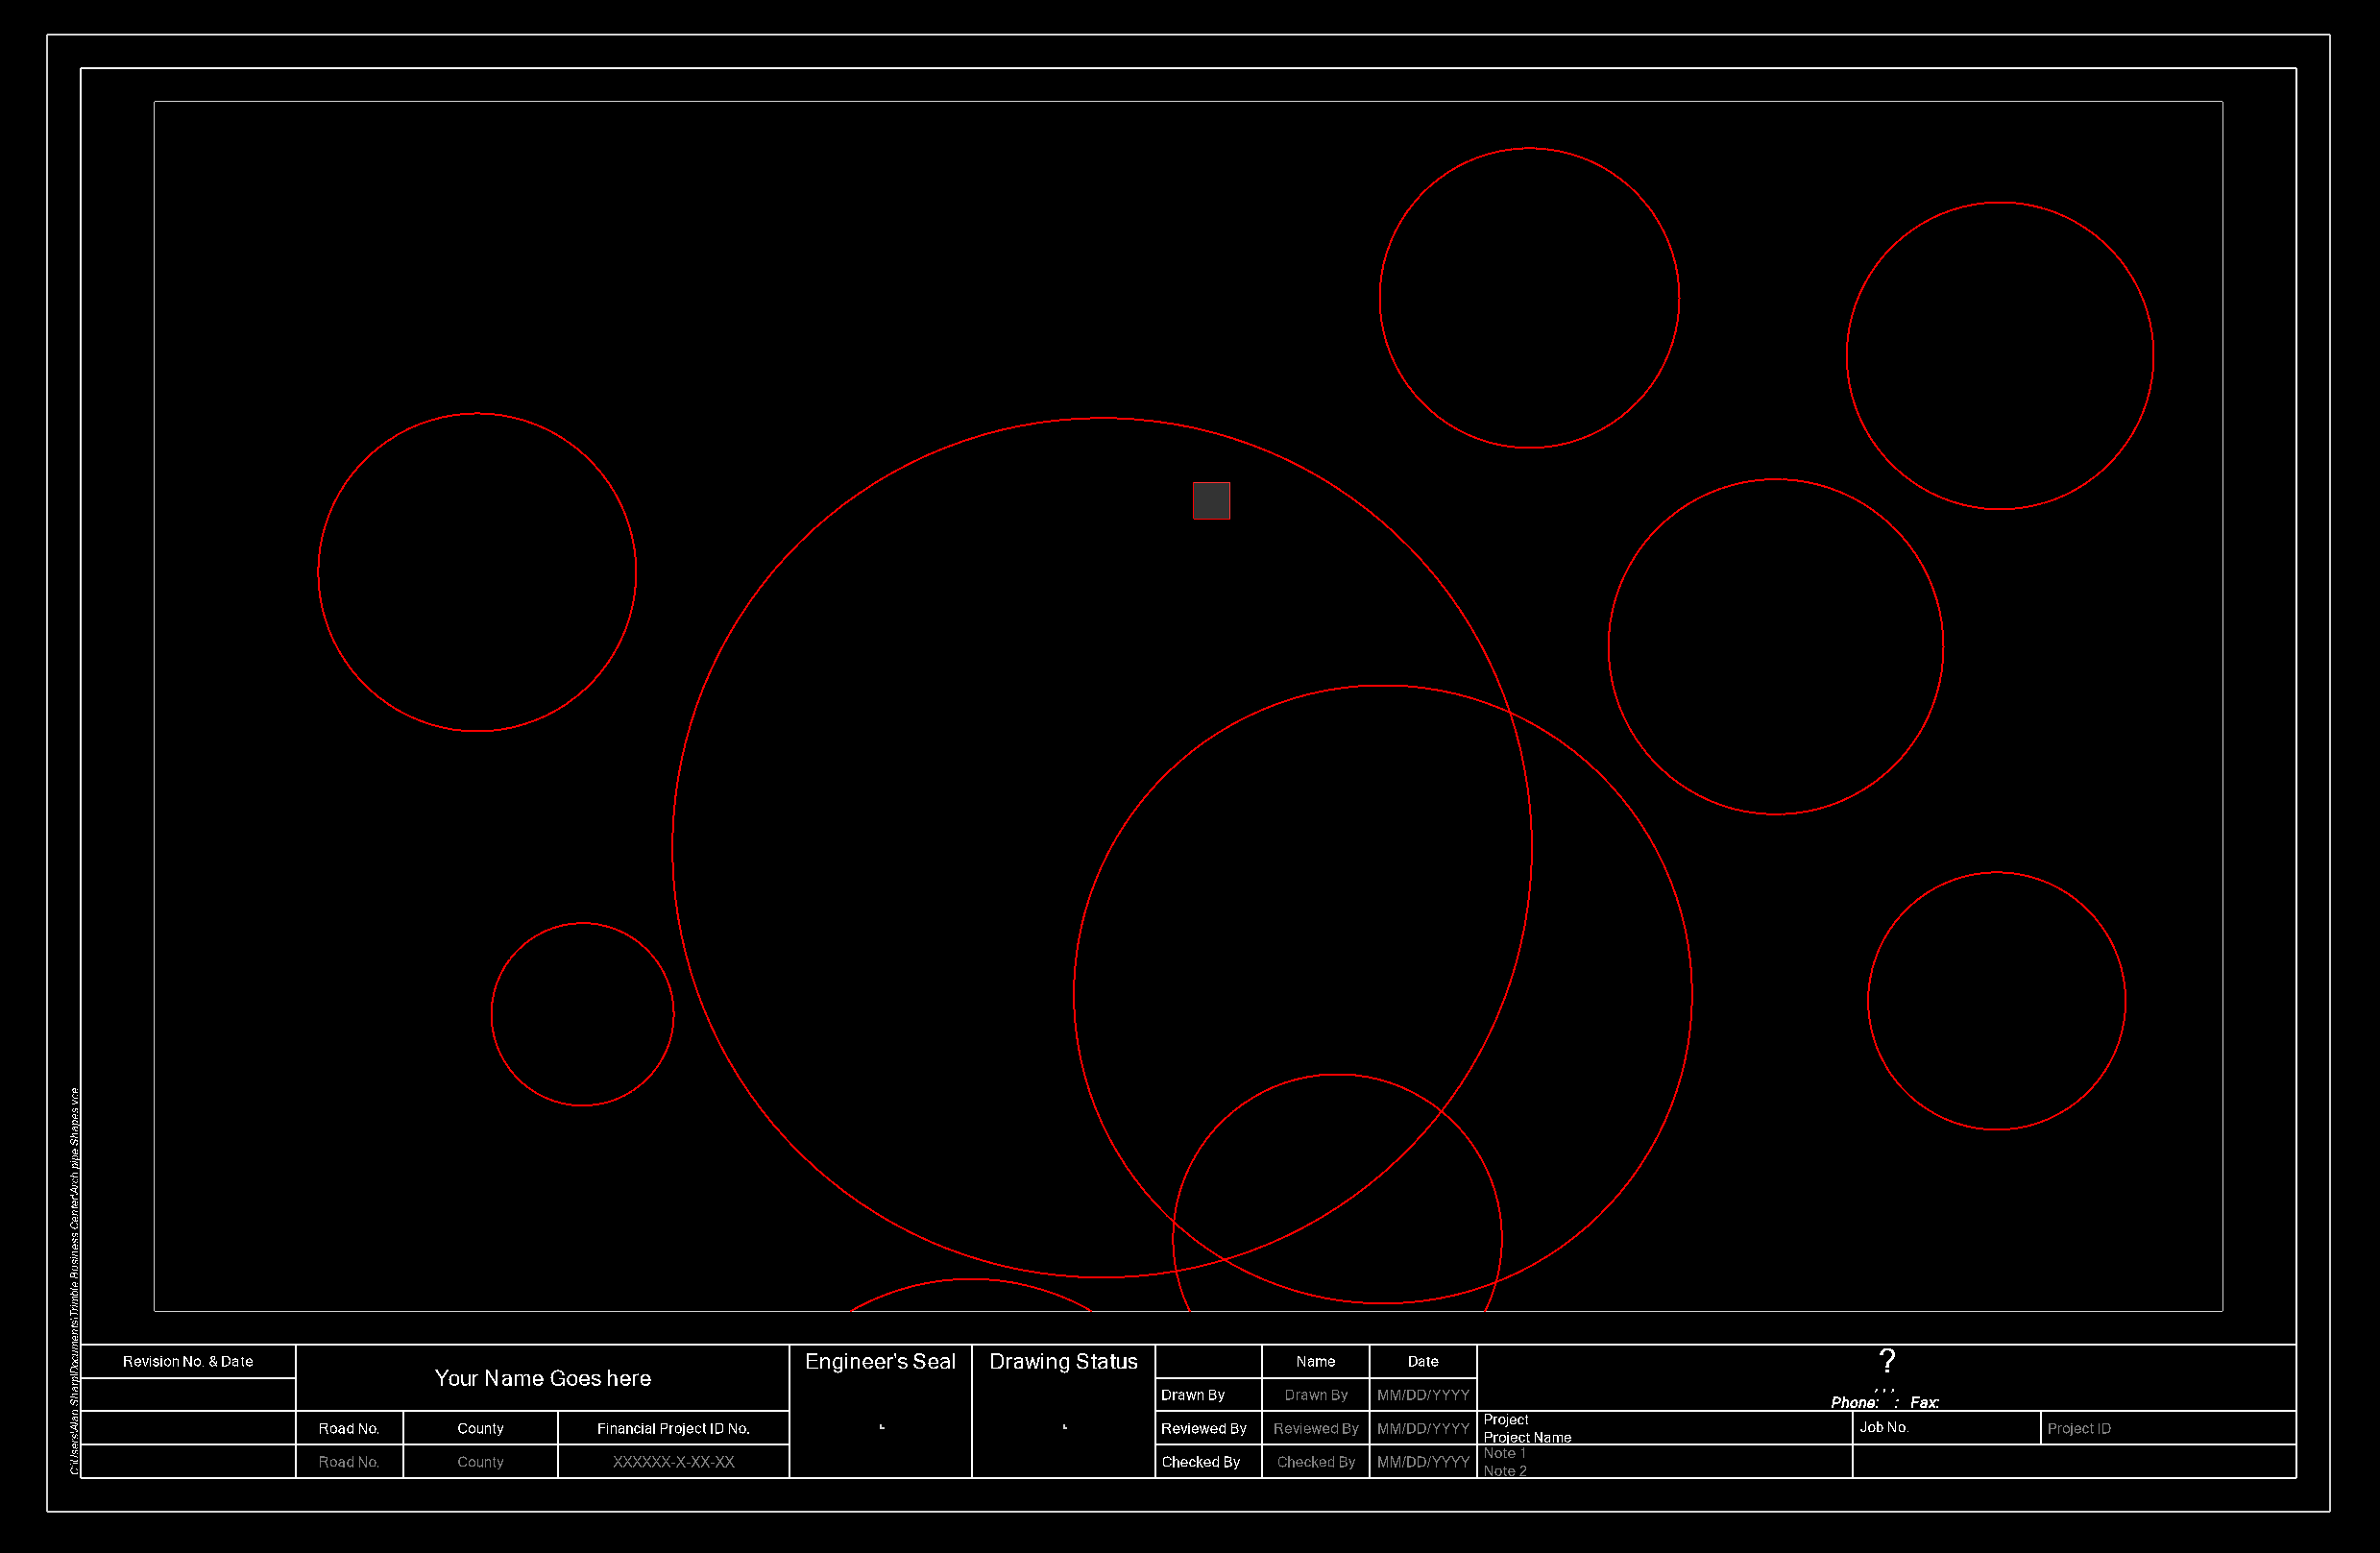
Putting an offset of 0.25 will create a boundary at a minimum of 0.25’ around the inside of the grey area in the drawing sheet as shown below - note that depending on the size of your boundary in the plan view (width and height), the boundary will be fitted to the available drawing area and will often result in a 0.25 offset either above and below or left and right of the Dynaview on the sheet, with a larger border on the other axis of the sheet as shown here.
Dynaview Offset X
When you place the Dynaview on the drawing sheet, you can decide to offset the dynaview within the available drawing area on the sheet or not. The value that you type in here and the Y setting below will add a border area between the Dynaview and the available space border. You can enter e.g. 0.0” or 0.25” here as an offset value.
Dynaview Offset Y
When you place the Dynaview on the drawing sheet, you can decide to offset the dynaview within the available drawing area on the sheet or not. The value that you type in here and the X setting above will add a border area between the Dynaview and the available space border. You can enter e.g. 0.0” or 0.25” here as an offset value.
Dynaview Creation Options
If you are using the RPS standard templates for your drawings, you will select Auto Dynaview here. If you are using your own Drafting Templates then you can use the Auto Dynaview method if you have defined your drawing template in an appropriate way, or you can overide the auto settings and define settings that control the absolute placement of the Dynaview on your drafting template(s).
The Auto method looks at the drawing sheet, finds the largest available area and determines the centroid of that area, and then tracks out to find that areas boundary. The boundary defines the Height and Width of the available area. That available area is then used by Smart Plot to create the Dynaview Fram in the Plan or Profile View that has the same ratio of width x height, but is scaled at either a user deined scale or an auto computed scale, depending on how Smart Plot is being used.
Typically use the Auto mode unless your drawing sheet template is very specific and the auto mode simply does not work for you for some reason.
Offset From Left
This is the offset of the dynaview corner from the left side of the sheet ie on a 17 x 11 Landscape sheet, this would be e.g. 0.25 from the left edge of the sheet (0.25).
Offset from Right
This is the offset of the dynaview corner from the right side of the sheet ie on a 17 x 11 Landscape sheet, this would be e.g. 0.25 from the right edge of the sheet (16.75)
Offset From Top
This is the offset of the dynaview corner from the top of the sheet ie on a 17 x 11 Landscape sheet, this would be e.g. 0.25 from the top of the sheet (10.75)
Offset From Bottom
This is the offset of the dynaview corner from the bottom of the sheet ie on a 17 x 11 Landscape sheet, this would be e.g. 0.25 from the bottom of the sheet (0.25)
If the sheet has a 0.25 Border and a 1.5” Title Box along the bottom of the sheet, then the offsets would be as follows
Offset from Left = 0.5 (allows 0.25 for the border and an additional 0.25)
Ofset from Right = 0.5 (allows 0.25 for the border and an additional 0.25)
Offset from Top = 0.5 (allows 0.25 for the border and an additional 0.25)
Offset from Bottom = 2.0 (allows 0.25 for the border, 1.5" for the title box and an additional 0.25)
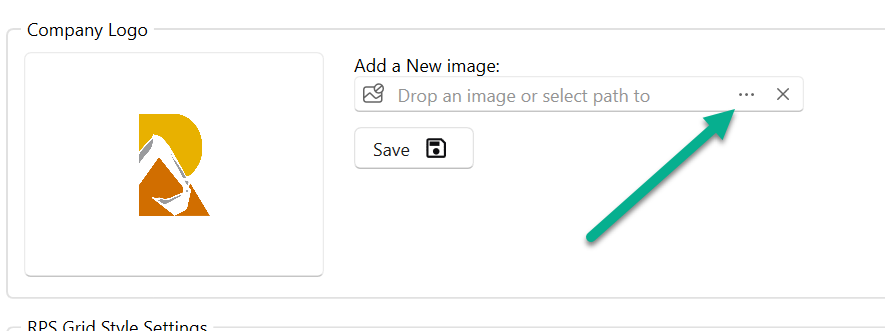
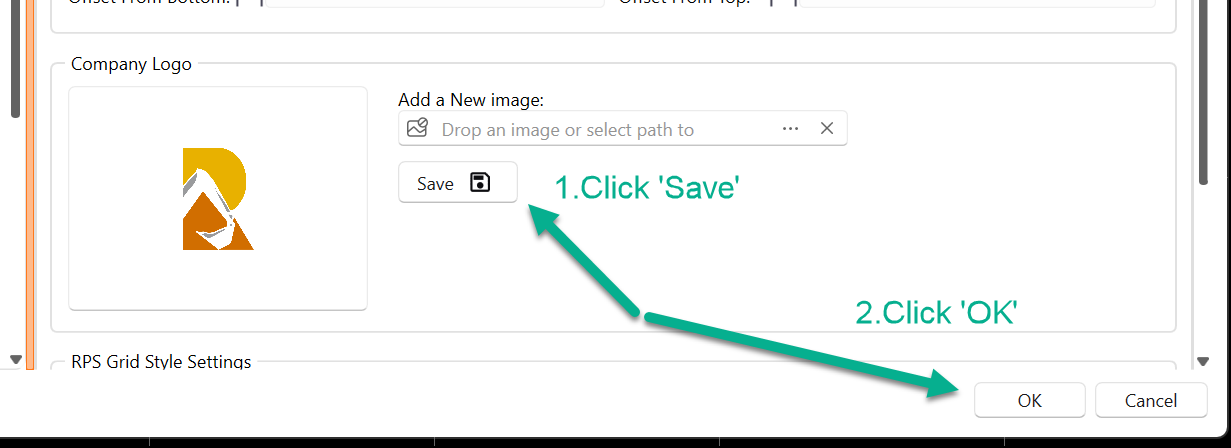
Template Icon
In this section you can add your company logo, the logo will be sized and placed in a specific location of each of the RPS drawing sheet templates as shown in the earlier drawing shet template images. You can drag and drop the logo or browse to the path where the logo is stored ad select it. The logo image should have a white or transparent background.
RPS Grid Style Settings
If you wish to place drawing grids on your plan or profile drawings, you can define the default grid stye parameters here. These will be applied automatically to the Plan and Profile Dynaviews that get placed on drawing sheets using Smart Plot. Note that these supplement any Grid Styles that you may have already defined. There is one style for plans (Northing Easting grid) and a second style for profuile drawings (Station / Elevation grid).
RPS Grid Style
Select the RPS Grid Style that you want to define - Plan or Profile.
Line Style
The options for line style are Grid or Tick. Grid is solid lines and Tick is a cross at each grid intersection location.
Label Layer
Select the layer for the grid labls that will be created. The RPS default for this is SHEET - Grid Labels.
Major Interv.
Select the Major Interval e.g. every 2 or every 4 or every 5 or every 10 minor intervals. You can override the Minor Interval setting in Smart Plot itself i.e. you can set 500 in the next setting for the Minor Intervals, but then override it to 10, 50, 100 in Smart Plot depending on the project area / size, and then this setting controls the Major and Minor grid intervals that are created.
Minor Interv.
Select a default Minor Interval setting for the grids e.g. 500’ ft.
Major Style
Select either Solid or Dashed line style for the major grid lines being created.
Minor Style
Select either Solid or Dashed line style for the minr grid lines being created.
Major Layer
Select the layer onto which you want to place the Major Grid Lines. The RPS default for this is SHEET - Grids - Major.
Minor Layer
Select the layer onto which you want to place the Minor Grid Lines. The RPS default for this is SHEET - Grids - Minor.
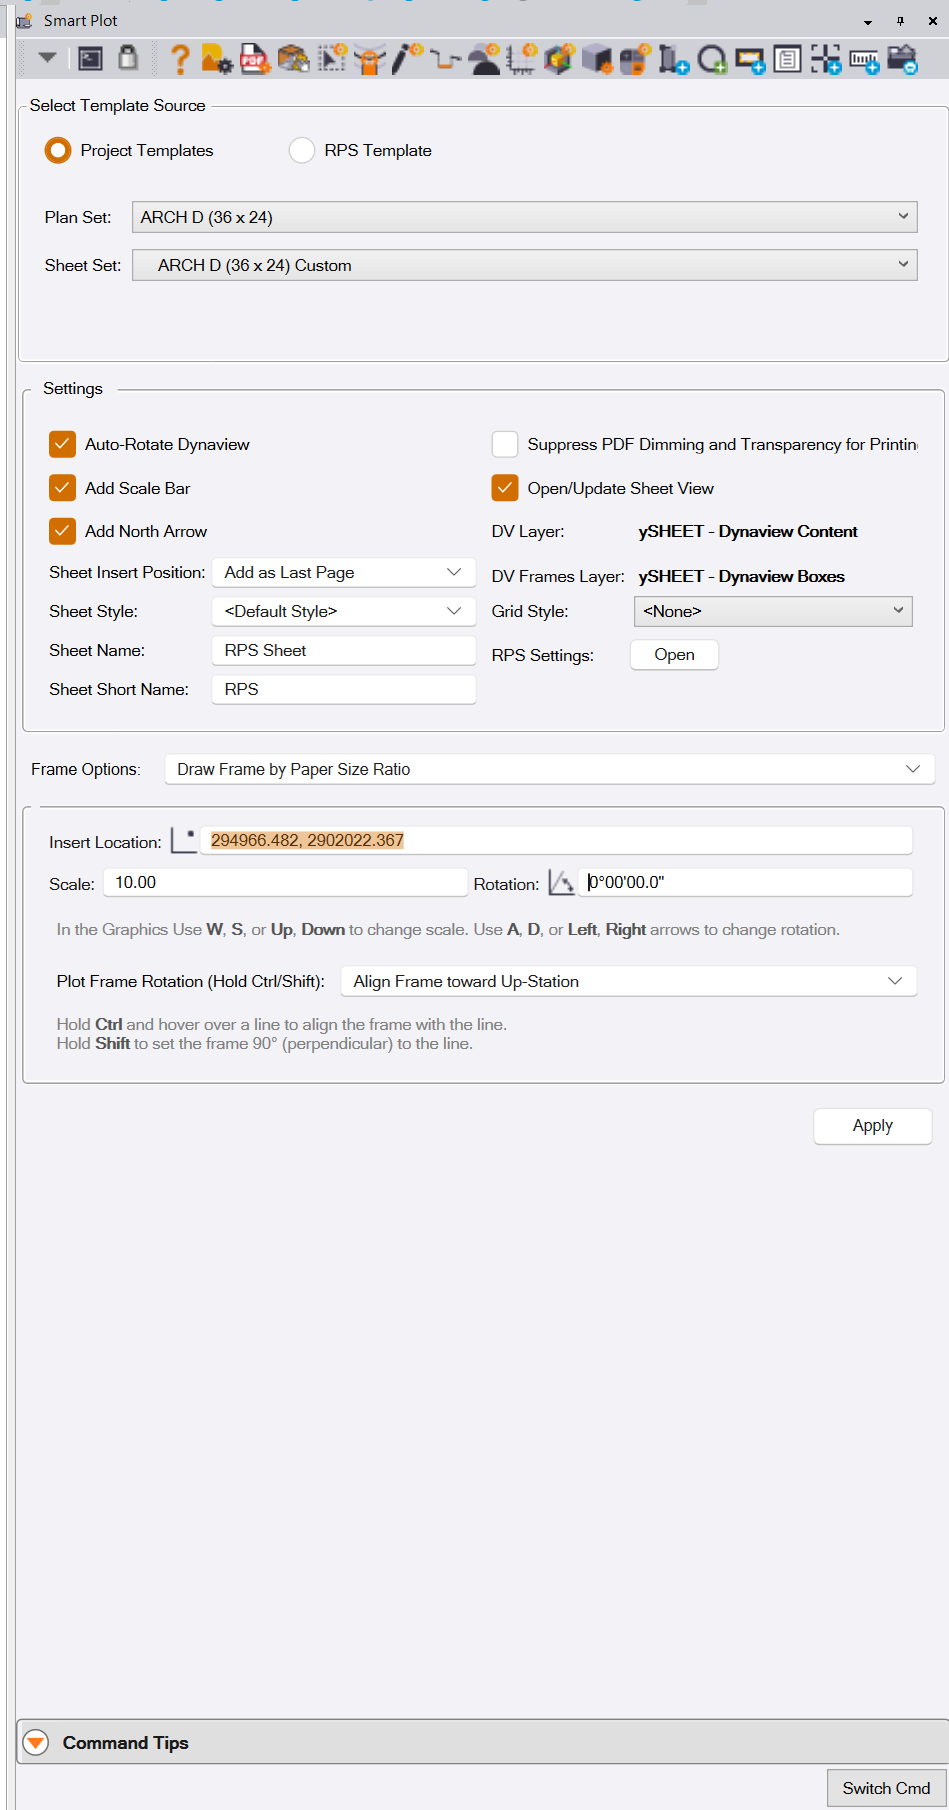
Smart Plot Settings
In this section of the Smart Plot dialog you are setting up the sheet creation process.
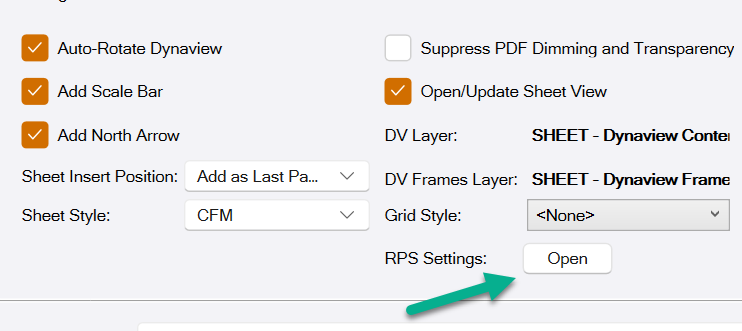
Auto-Rotate Dynaview Checkbox
Typically you will always want this checked on. This will automatically rotate a rotated dynaview so that it appears square on the drawing sheet. This is typically what you will want in most cases, unless for some reason you need to draw the dynaview skewed on the sheet to maintain North is Up on the sheet.
Add Scale Bar Checkbox
Check this checkbox if you wish to add a Scale Bar to the drawing created
Add North Arrow Checkbox
Check this checkbox if you wish to add a North Arrow to the drawing created

Suppress PDF Dimming and Transparency For Printing Checkbox
When PDF files are imported and georeferenced using e.g. PDF Manager command, it is common for users tio apply dimming and transparency to those PDF images when placed in the TBC Plan View. When you come round to printing, it is a common need to not have the dimming and transparency appplied to the PDFs used in the background of the dynaview. Normally this means going to all the placed PDF Images and changin these properties to undimmed and 0% transparency for the print process, and then change them back again to show the dimming and transparency afterwards.
If Smart Plot is open in background while you are running the print Plan Set command, checking this checkbox will disable the Dimming and Transparency of the PDF images for the printing process. When Smart Plot is closed the images will return to their default settings for dimming and transparency.
Open / Update Sheet View Checkbox
If you are creating just a single sheet output, Smart Plot will automatically open the Sheet View Pane and make it active by default so that you can preview each sheet as it is created and laid out. If however you are creating a large number of sheets, it can be annoying to have the Sheet View open and change focus from the plan view as each sheet is created, especially on large projects. Check this checkbox to suppress the opening of a Sheet View after each sheet is created.
DV Layer / DV Frames Layer
These display the current layers that will be used for the Dynaview Content and Dynaview Frames as defined by RPS Settings.
Sheet Insert Position
When you are creating multiple sheets in the same sheet set, as each sheet gets created it is placed in the sheet set. This setting controls where each new sheet is inserted into the Sheet Set. The options are
Add as Last Page - adds the sheet at the end of the sheet list
Add as First Page - adds each sheet as the start of the sheet list
Add as Only Page - adds a single sheet only to each sheet set i.e. each sheet becomes it’s own sheet set.
Sheet Type
Select the Sheet Type that you want to apply to the available drawing area (this handles the use of the drawing area and applies the splits as defined in RPS Settings. See RPS Settings for more details.
Grid Style
Select the Grid Style tat you wish to apply to the sheet being created. You can select None or RPS Grid Style Plan or RPS Grid Style Profie. If you have your own Grid Styles defined (using the Grid Style Manager) then you can select one of these options also.
RPS Settings - Open Button
Click this button or the RPS Settings button in the header bar icons to open RPS Settings, Select the Smart Plot settings and then modify the settings to meet your requirements.
Frame Options
In this area of the command dialog, you control the way that the drawing sheet is created. First we will explain the overall process that is being executed here.
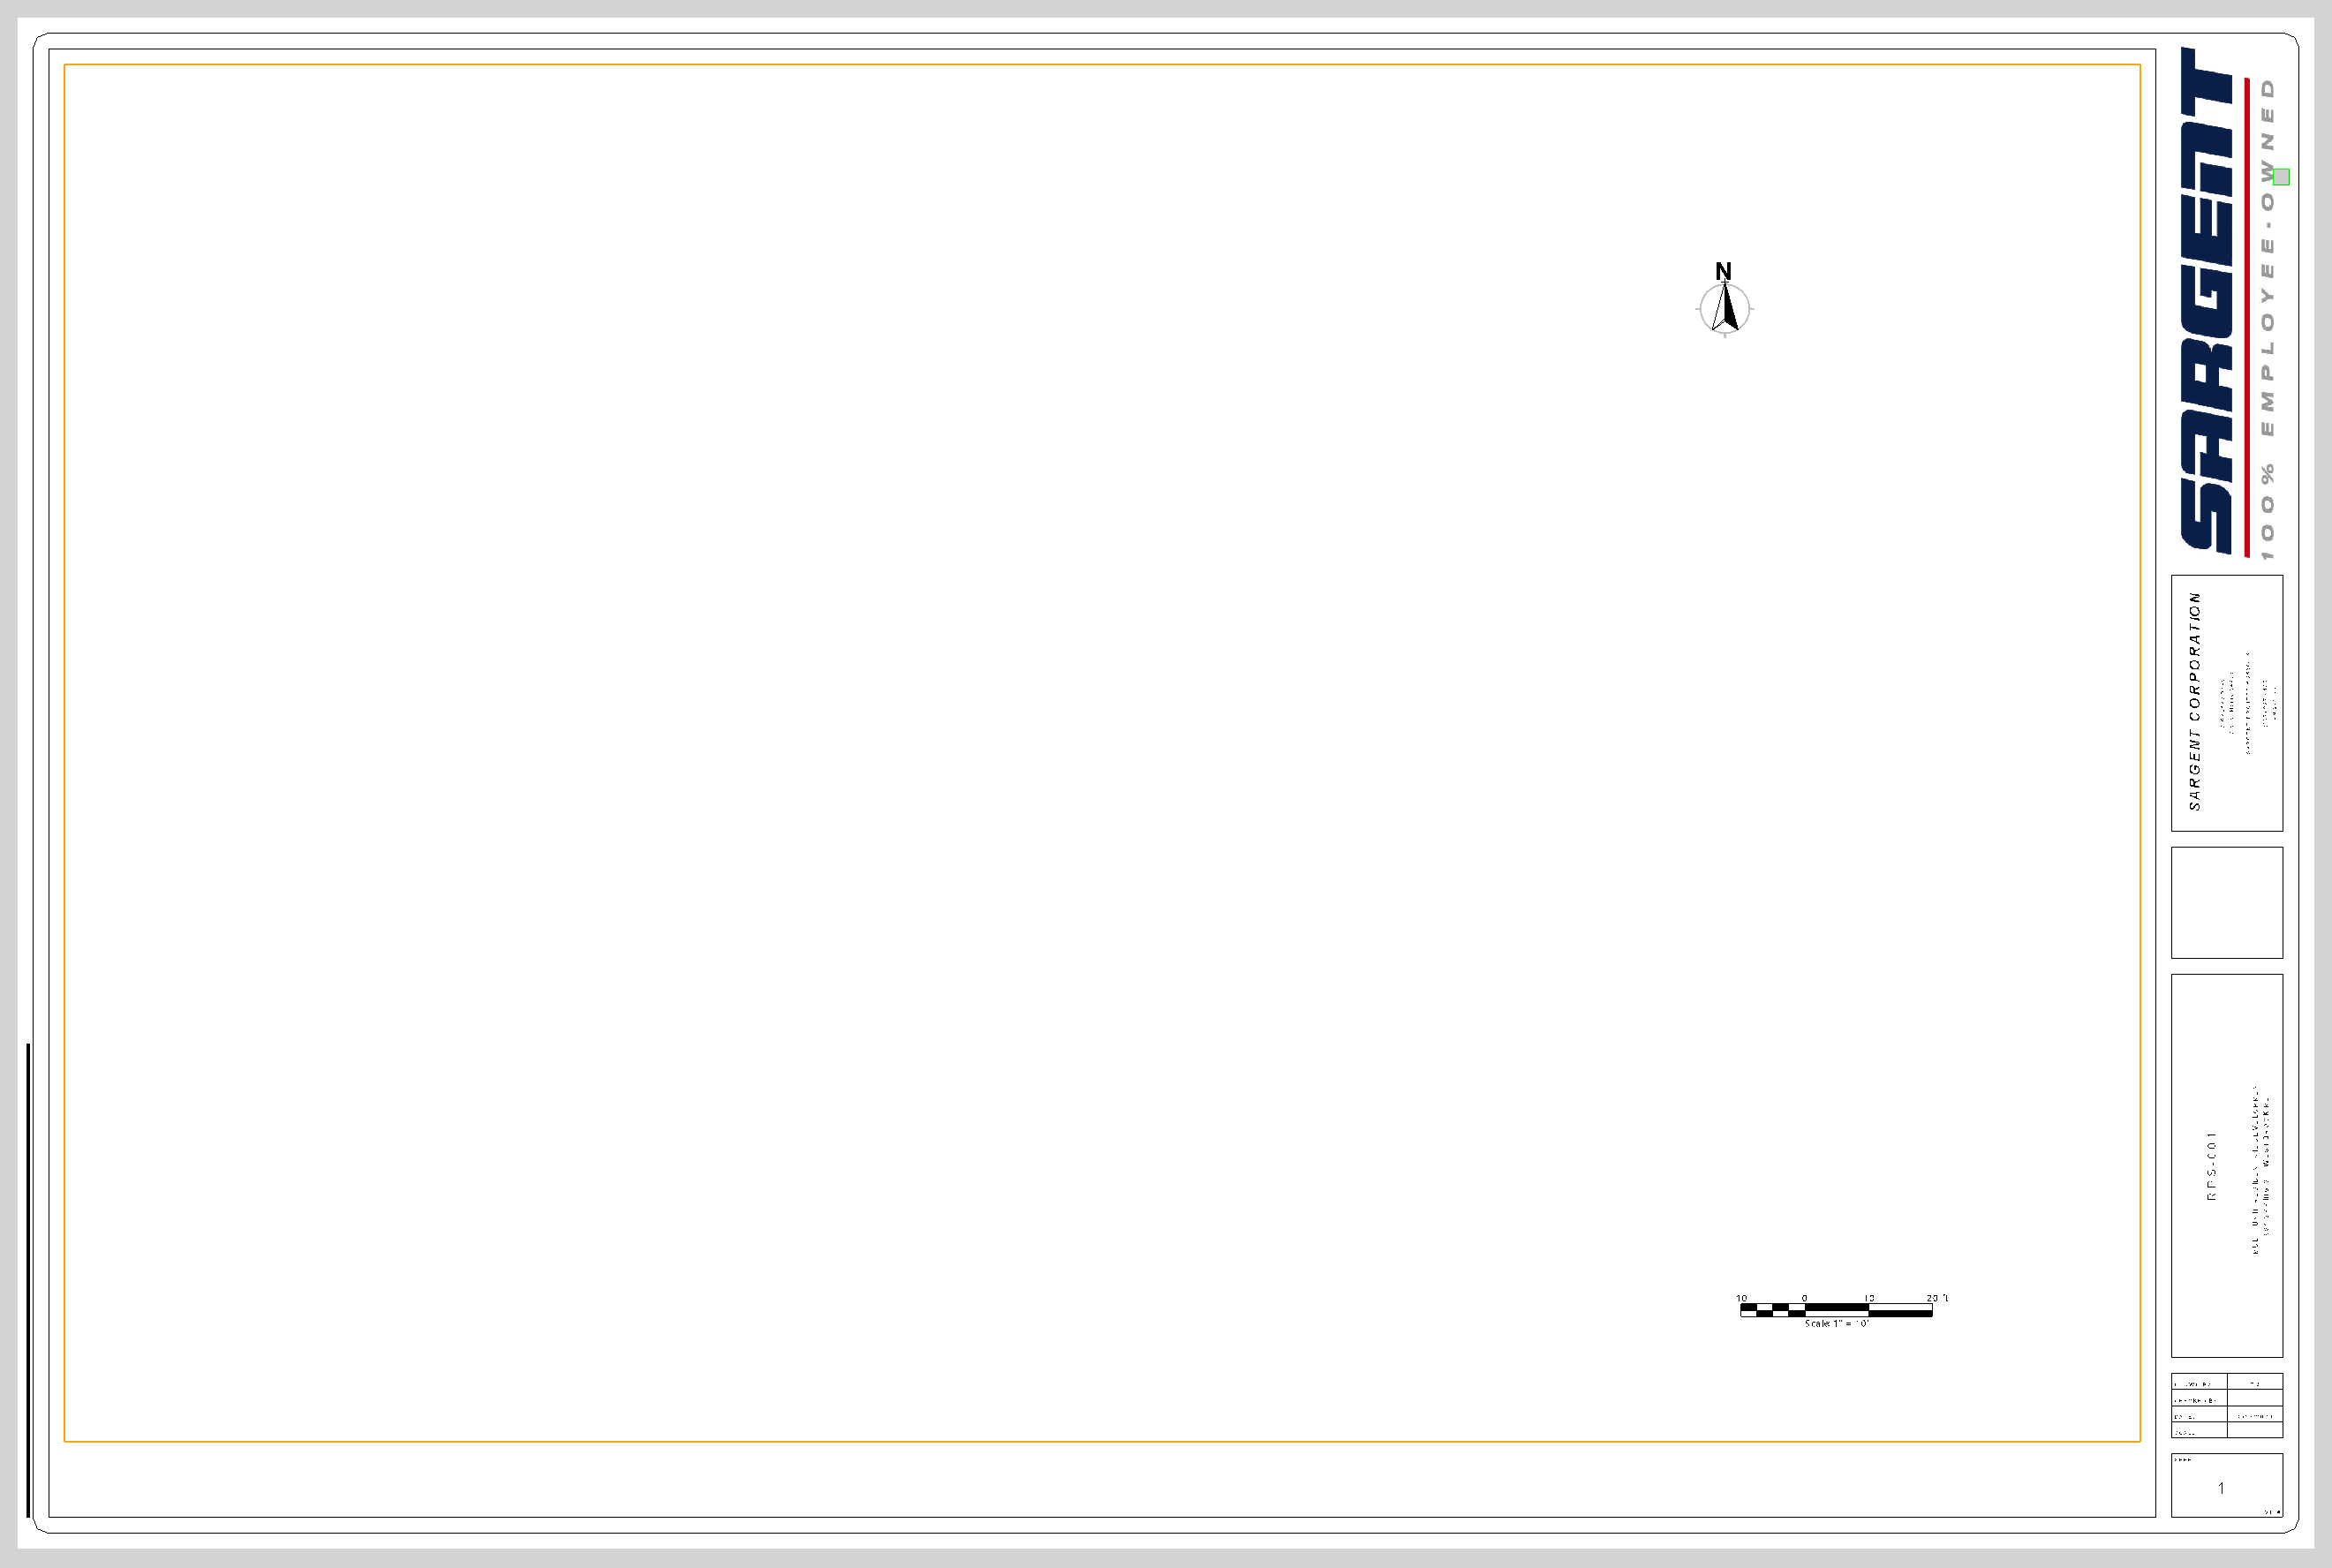
- First you select a drawing template that is the foundation of the drawing sheet - this includes the paper size, the sheet orientation (Portrait or Landscape), and the Title Box and Borders detail - these contain things like the Project Name, Description, who created the drawing and when, and your Company Name, Address and Logos etc. The drawing sheet has a remaining drawing area, above the title box and within the defined sheet borders. It is in this area where we will create the drawing - that area has a width and height in inches. Depending on the scale you define (or let the software decide), and the area of the plan view that you select to create the drawing from, will dictate how the drawing will be created in that available space.
- Next you will select an area in the plan view (one or more), defined by a boundary that either exists already or that you will define in this process, and it will work out the best way to fit that on the sheet at either the defined scale or at a best fit to the available drawing area.
- Once you have the boundary created / selected, TBC creates a Dynaview from the boundary, that connects the data that lies within the boundary and places it on the drawing sheet. In this process if the boundary is rotated, the Dynaview process will rotate the frame area so that it ends up square on the drawing sheet.
- Lastly, once the Dynaview has been placed on the drawing sheet, it is assigned a View Filter. The View Filter turns layers, surfaces, images etc. On or Off to create the view on the drawing the way that you want it. It can use a flexible view filter like My Filter so that what is on the drawing sheet at any given time is what s visible in the plan view of TBC. It can also be a custom View Filter that is “locked up” so that it only displays specific information e.g. A Cut Fill Map, a Site Improvement Map, a Work In progress Survey, an As Built Drawing etc. The View Filter allows you to quickly change the content of your drawing sheets, allowing you to create new drawings extremely quickly.
The following options are available to you for creating the boundaries / frames that will drive the Dynaview process.
1 - Draw Frame by Paper Size Ratio
2 - Select Frame
3 - Capture Screen
4 - Draw Frame
Options 2, 3 and 4 will place the drawing on the sheet at the best fit scale to maximize the available space - these are ideal for rapidly creating e.g. a single sheet drawing of Cut Fill Maps, Site Improvement Maps, Work In Progress or As Builts etc.
Option 1 allows you to define the scale, location and orientation of a boundary. The size of the boundary is determined by the software for you to automate the placement of the drawing at your preferred scale.
Draw Boundary by Paper Ratio Method
In this mode you will select the location for the Dynaview Frame, input or select the desired scale and input or set the rotation of the boundary to get a drawing sheet at specific scale that fits the plan view data that you want on the sheet.
Insert Location
You can set and reset the location as often as you want, the rectangle will also attach to the cursor so as the cursor moves on screen, you can accurately position the frame exactly where you need it. You can also use the snap functions to snap to CAD, PDF or PDF Vector points to precisely match up your drawing sheets.
Select the location for the boundary.
Scale
You can set a specific scale, the rectangle will auto size and show you the area that will be covered at that scale. You can change the scale value or use the hot keys below to increase or decrease the scale which will increase or decrease the size of the rectangle to fit the defined scale.
Select the scale that you wish to use.
Scale Hot Keys
W, Up Arrow = Increase Scale
S, Left Arrow = Decrease Scale
Rotation
You can set a specific rotation angle, the rectangle will rotate and show you the area that will be covered at the current scale and rotation. You can set the rotation value, you can use the TBC snaps to extract the correct orientation, and you can use the hot keys below to dynamically rotate the boundary to give you the best fit on the data in the plan view.
Select the rotation angle for the drawing sheet.
Rotation Hot Keys
A, Left Arrow = Rotate Anti-Clockwise
D, Right Arrow = Rotate Clockwise
Once you are happy with the location, scale and rotation, press Enter or click Apply to execute the creation of the drawing sheet.
Plot Frame Rotation
While placing the frame in the plan view, you can hold the CTRL key down and hover over a line or alignment to align the dynaview frame to the line or alignment at that point.
While placing the frame in the plan view, you can hold SHIFT key down and hover over a line or alignment to align the dnaview frame perpendicular to the line or alignment at that point.
In either mode, the frame will dynamically rotate as you continue to hold the CTRL or SHIFT keys down and move te cursor along the line or alignment.
There are three options on how you may want to control the way the frame is placed and how the frame handles an alignment that horseshos on itself, which would cause the dynaview frame to become inverted for certain sections of a road or pipeline for example.
Align Frame Toward Up Station - The long axis of the dynaview frame aligns to the alignment, the left corner is up station, the right corner down station. Note for a road that has a W to E alignment, this will place the Dynaview Frame so that it is upright in the Plan View
Align Frame Toward Down Station - The long axis of the dynaview frame aligns to the alignment, the left corner is down station, the right corner up station. Note for a road that has a W to E alignment, this will place the Dynaview Frame so that it is inverted in the Plan View
Auto Flip - in this mode, the dynaview frame will automatically flip so that it stays upright as it follows a horsehoe shaped alignment or line.
Select Frame Method
In this case, the frames are already drawn in the plan view, they can be any shape, any rotation and any size. When you select the boundary to place on the selected sheet template (sheet size and orientation), the Dynaview is auto-scaled to fit on the available drawing space, maximizing the use of the available space.
Select Frame
Select a single frame line i.e. a closed polygonal line (Polyline, Linestring, Boundary, Polygon etc.) that will act as the frame for the Dynaview.
If you wish to map these boundaries to imported and placed georeferenced PDF sheets, you can do that so that you can mark up your Engineers drawings with the related data from the project directly.
If the boundary is a rectangle, it will be rotated so that the rectangle is square to the drawing sheet. If the boundary is a circle or an irregular polgon shape, it will always be placed North Up on the drawing sheet.
Simply select the boundary and press Enter or Apply to execute the creation of the drawing sheet.
Capture Screen Method
Very often, you just want to capture the area of the current plan view screen to generate your drawing. Use this mode to get a one click drawing from the graphics area currently covered by the plan view screen.
Simply set up the plan view the way you want your drawing to be, set you view filter as you need it and hit Apply or press Enter to capture the drawing details.
Draw Frame Method
In this mode you will create a Frame. The Frame will be drawn parallel with the X and Y axis and will be North Up. The boundary is drawn using the RPS Expanding Rectangle method, in this you can define the normal two corners (e.g. top left and bottom right corners). You can also chip away at the rectangle once it has been drawn to make minor adjustments that make the rectangle larger or smaller than it is currently. You can also define the rectangle using a point on each side, when there are no clear corners to work with.
Clipping Point
As you click points in the plan view to frame up the area of project that you want to place on the drawing, a yellow rectangle is drawn to show you the area as it currently stands.
To change the width of the rectangle, click towards the center of the sides of the rectangle left or right, top or bottom, and inside or outside the current rectangle to make the rectangle larger, smaller etc.
As you define the boundary, the current scale that will be used on the drawing sheet will be displayed in the top right corner of the boundary area. The scale is a “random scale” that will best fit the boundary onto the drawing sheet while maximizing the available space on the drawing sheet.
While you are moving the cursor, the scale that will be used if you click the current curosr position is displayed n the cursor and dynamically updates as you move the cursor around in the plan view.
When you have the boundary a you want it, press Enter or Apply to execute the creation of the sheet.
Reviewing and Plotting / Printing / PDF Output of the Drawing Sheets
To review any of the drawing sheets, simply open the Project Explorer, locate the section called Plan Sets, expand that to see your Plan Sets, Sheet Sets and Sheets. Select the sheet you want to review, right click and select New Sheet View. The Sheet View will open and display the drawing sheet and Dynaview content that is available for that sheet.
To review a different sheet, either repeat the above process or simply select a different sheet in the sheet selector at the base of the Sheet View. Once the sheet selector is highlighted, you can browse through the sheets using the up and down arrow keys on your keyboard.
To change the content of your drawing sheet, click in the dynaview on the drawing and review the Dynaview properties. In the properties pane, change the view filter to the one you want to use to create the updated drawing. If the Dynaview is using the MyFilter view filter, simply switch things on and off in the view filter manager till you get what you want on screen, and then click Refresh All in the Sheet View to refresh the dynaview with the new content.
To change the area covered by a Dynaview, in the Plan View use TBC Grip Edits to select and move the frame of the dynaview to where you need it. As you move it the Drawing Sheet will update to reflect the new drawing area in the plan view.
To change the View Filter that is being applied to multiple sheets at the same time, select the Sheet Set level in the Sheet Selector while holding the SHIFT key down. This puts the Sheet View into MultiSheet View (multiple Sheets visible at the same time). Do a small window select over the edge of the Dynaview frames to select them all and then change the View Filter selected in the properties pane. This will update all of the sheets in a single step. To return to single sheet, select a single sheet in the Sheet Selector of the Sheet View.
To Print drawing sheets, use the TBC Print Plan Set command from the Sheet Layout menu. You can also access this in the lower right corner of the Sheet View (TBC v2025.2 and newer only)
Header Bar Commands
In the header bar of the command dialog you will find icons that provide quick links to other commands that you may find useful while using Smart Plot. The icons act as a toggle between currently running commands, and also trigger start up of additional commands as needed. Header Bar commands in Smart Plot include the following
- Help (This document)
- RPS Settings
- PDF manager
- CAD Cleanup
- Smart Select
- Smart Draw
- Smart Edit
- Smart Elevate
- Smart Feature
- Smart Profile
- Smart Model
- Volumes Manager
- Smart Takeoff
- Create 3 Point Rectangle
- Create Circle
- Create Boundary
- Insert Block
- New Sheet View
- Create Scale Bar
- Print Plan Set
Other Command Dialog Controls
Apply
Click the Apply button or press the Enter key on your keyboard to create the drawing sheet and ready yourself to create another drawing sheet.
Switch Cmd
The Switch Cmd button provides quick access to all currently running RPS Smart Suite commands. In addition it provides the ability to close the current command, or all commands that are currently running. The Switch cmd capability can also be executed using the ESC key on your keyboard, this will pop up the switch command list right on your mouse cursor. To exit the current command you can also press ESC ESC on your keyboard to close the command.
Command Tips
the command tips area of the command provides access to the help document for the command (this document). In addition any useful tips or shortcuts that maybe useful to know while running the command will also be listed here.
In Context Video Demonstrations
In this section, you will find short videos that show you how to use the RPS Smart Plot command in different workflow contexts.
Enhancement Requests
If you would like to provide feedback or enhancement requests on this command, please click Reply below.