Cloud Services - Raindrop Path Analysis

Function Overview
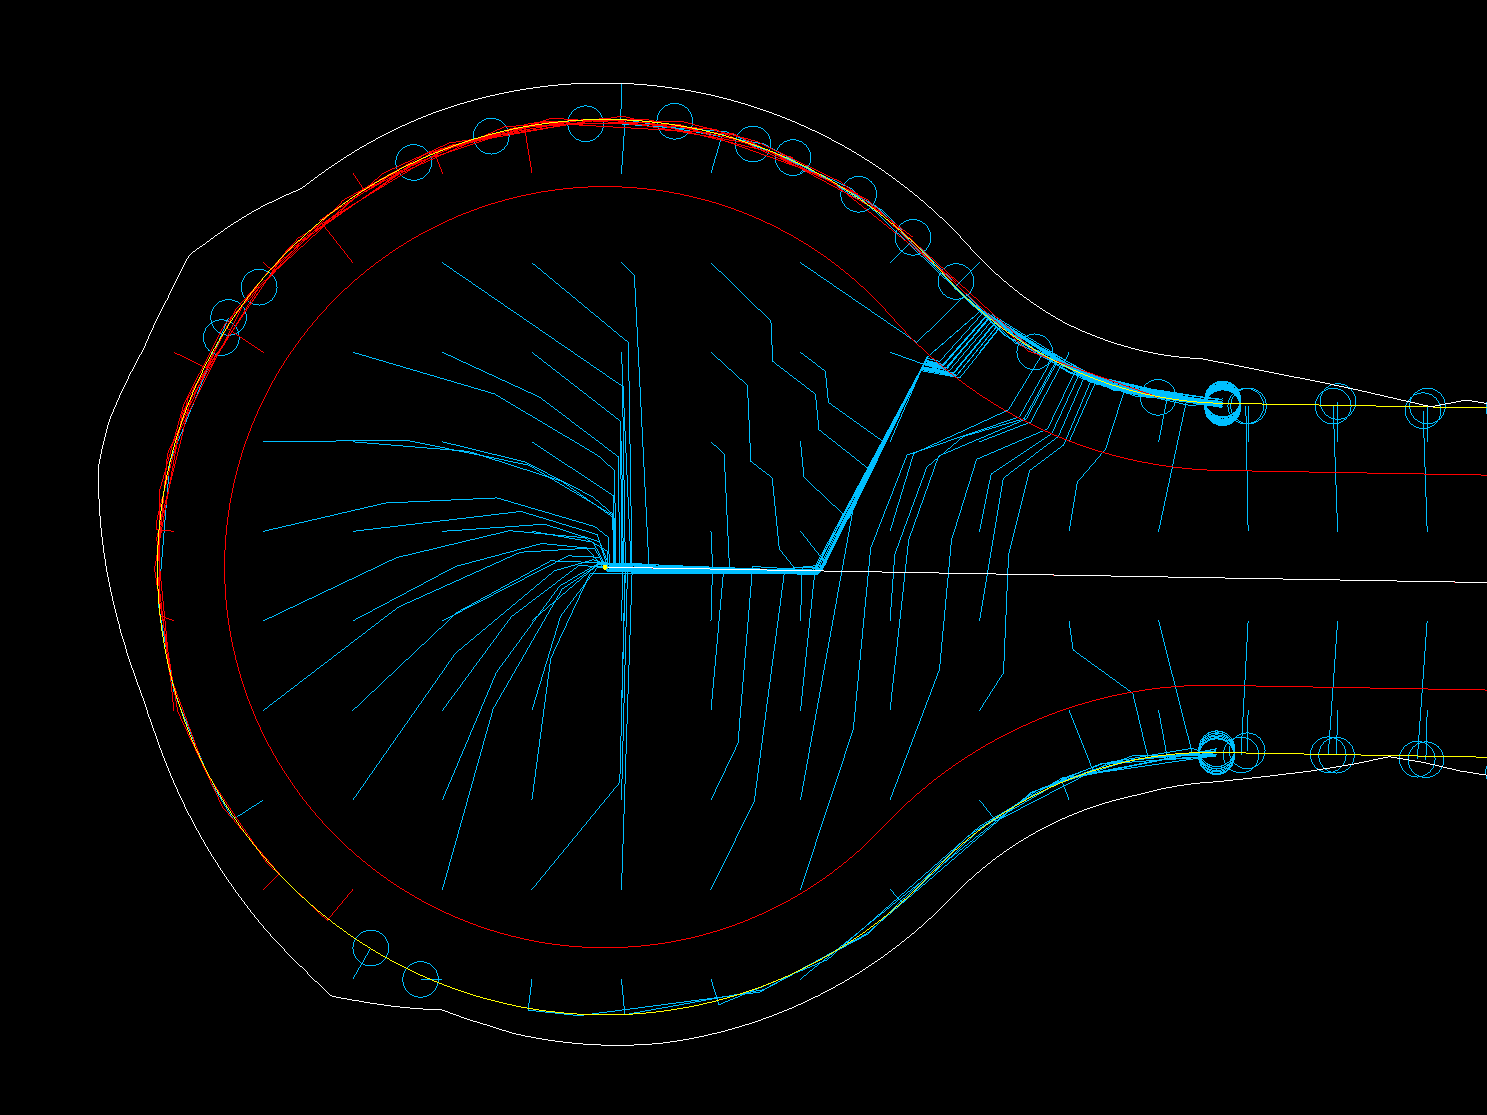
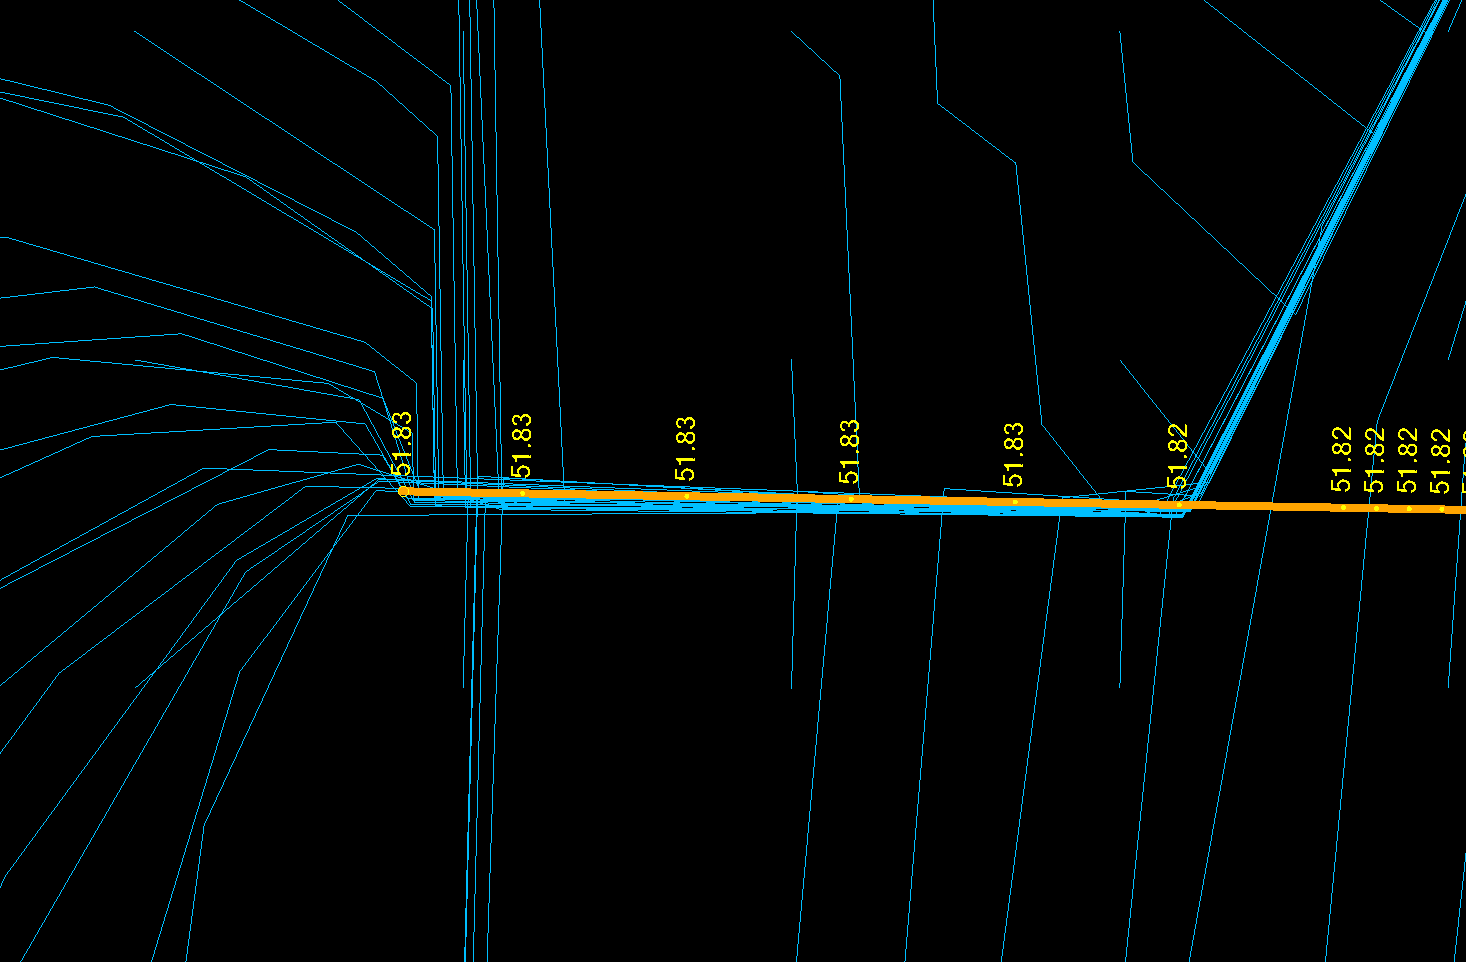
The raindrop path analysis provides a quick and easy way to review the way that water will drain across the terrain that you will soon be constructing on, across the site as it is today in the event of a large rainstorm, or across the design model that you are about to go build. By reviewing the drainage patterns of water across the jobsite, you can quicky identify the areas of the project likely to be affected by heavy rain, and also check that water is going to drain correctly post construction to link up with the Storm Water system for the project. The function drops water droplets on a regular grid pattern across the site, and tracks the path of the water droplets as they flow downhill to a bird bath or drainage point on the project. The results are presented as 3D lines that provide the flow path and a circle at the termination point of the flow line. Lines that pass and execute to completion are painted Blue, lines that fail to terminate because of processing limitations are painted red. You can adjust processing parameters and reprocess the lines that fail.

Video Demonstration
The following video shows you how to use the command
Release History
July 2025 - First Version released
Command Inputs
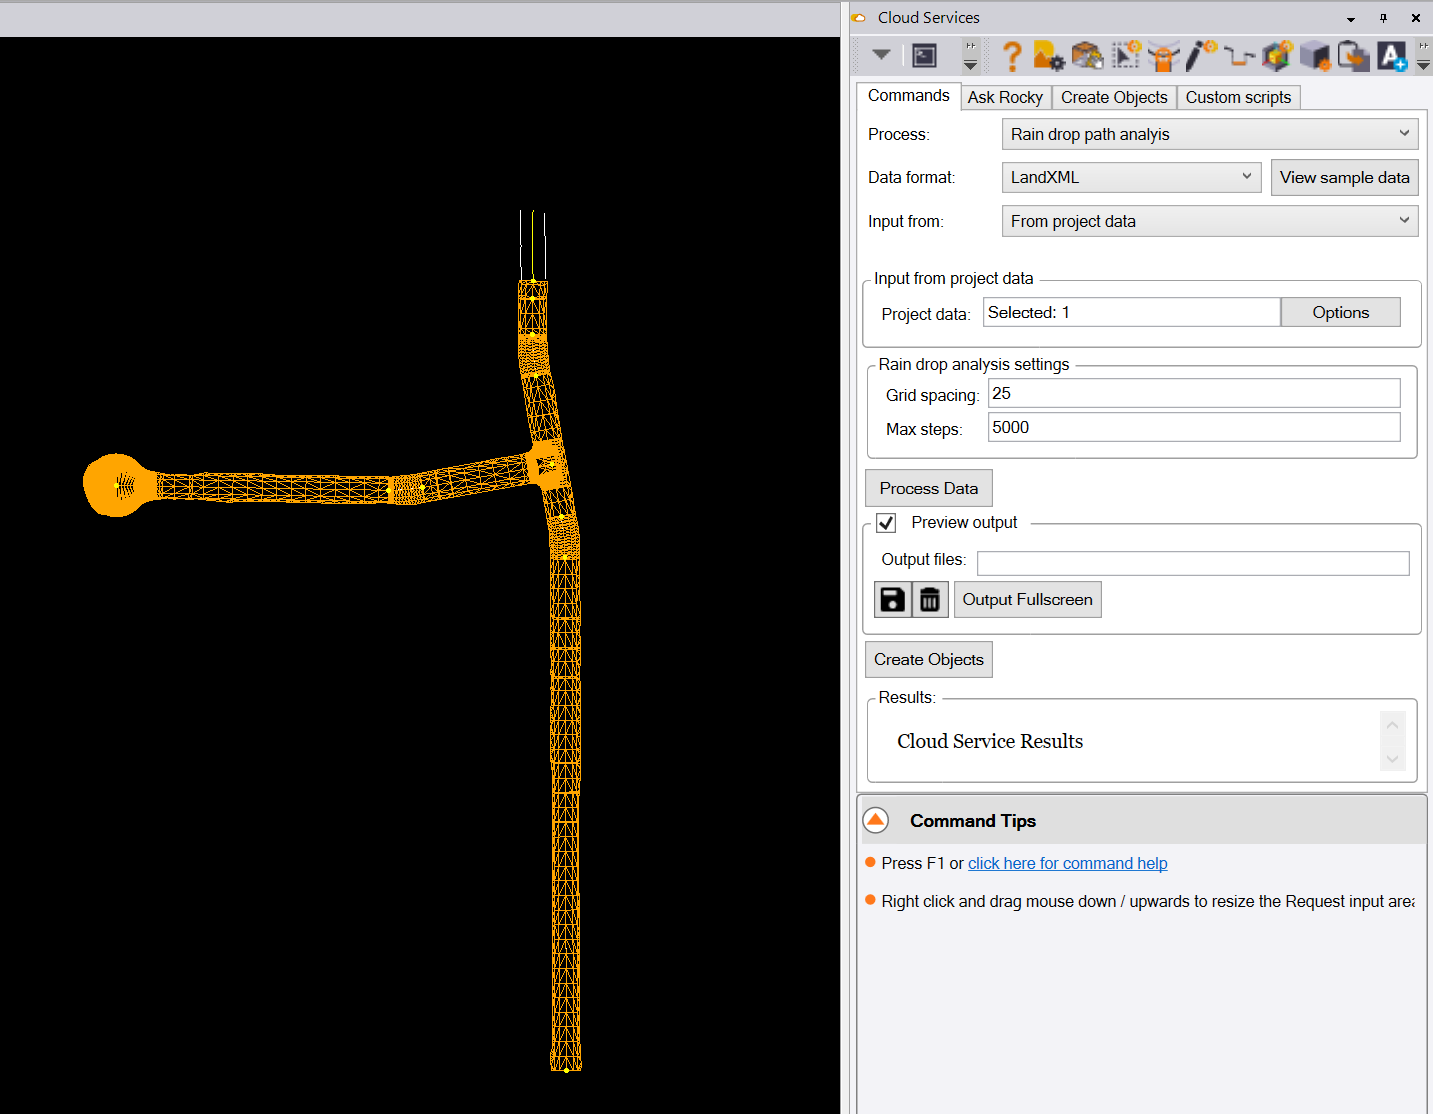
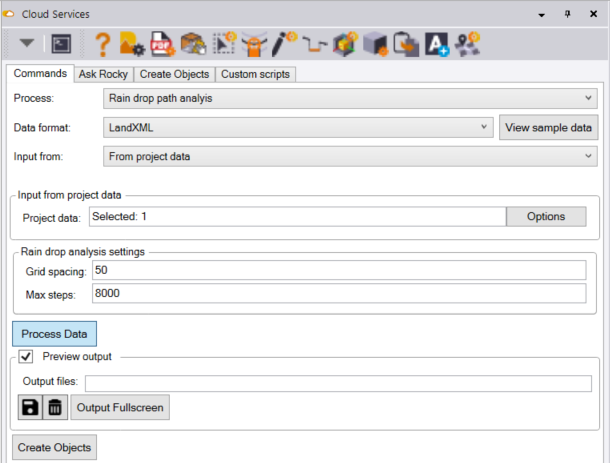
The command dialog looks as follows
Process
Select the Rain drop path analysis option from the pull down list of options
Data format
The process requires a source surface selected from the current TBC project or provided in a LandXML format. In either case, the process uses a LandXML surface model to provide the surface for the analysis.
Input from:
If you select From file, click the Attach file button, browse for and select the LandXML surface file that you wish to use for the analysis.
If you select From project, select the surface that you wish to use in the TBC graphics (Plan or 3D view) or project explorer - surfaces section.
Rain drop analysis settings - Grid spacing
The analysis requires a Grid spacing e.g. 50 x 50 or 25 x 25 grid - enter e.g. 50. Remember that the smaller grid you select the longer the processing will take, especially on larger projects. We recommend that you use a grid interval of 50 or higher
Rain drop analysis settings - Max steps
The Max steps setting defaults to 8000. This should be sufficient iterations to process the request being made on most projects. If you find that after processing some of your flow path lines are red vs the normal blue, that tells you that some of the lines truncated early because there were insufficient available steps to compute the entire line. The limit is set to restrict the command from getting into an infinite loop while processing. If lines fail to process completely, try increasing the Max steps setting to e.g. 10000 or 12000 to give it more iteration loops to resolve the truncation issue.
Process Data button
When you have the settings and data selections as you needs them, click the Process Data button to execute the task. Depending on the size of the project and the number of analysis points you have requested, the process can take a little time to compute all of the flow paths.
On successful execution, you will see flow path linework for the process that is placed on a layer called FLP - Surface Name - Water Drop Analysis in Layer Group 99L - DRAINAGE ANALYSIS. You will also find a circle placed at the termination point of each downhill flow path.
Data Outputs
The process also creates two output files
-
A DXF file of the flow linework called
e.g. WaterDropletPaths 250Grid ColorCoded_8000.dxf -
A CSV file with extension .RFA (Rainfall Analysis) that has all of the nodes of the raindrop paths coded so that you can import them into other software and join the points together with lines based on the feature code / string number and point sequence in the file. the file will be called
e.g. WaterDropletPaths_250Grid_ ColorCoded_8000.RFA