QA Floor Command

Command Licensing and Default Menu Location
- The QA Floor command is part of the RPS Modeling Toolbox
- The command is located on the Reporting menu ribbon
- The command is located in the QA menu group
Command Description
The QA Floor command analyzes terrestrial point cloud scan data for concrete floors and analyzes the floor for Flatness and Levelness to the ASTM E1155 standard guidelines. The command provides tools to generate the “Survey Lines” and to perform the ASTM analysis and automatically generates reports including graphs and drawing elements.
Video Demonstration
The following video shows how to utilize the QA Floor command for Single Section Floors
The following video shows you how to utilize the QA Floor command for Multi Section Floors
Background Information
The following websites provide good background reading for the ASTM E1155 standard and the definition of Floor Flatness and Floor Levelness.
- For Construction Pros Website - Click Here
- ASTM E1155 Website - Click Here
If you are engaging in this type of work we recommend that you purchase, download and familiarize yourself with the ASTM E1155 official documentation which costs $63.00 from the above website.
How does the analysis work?
The ASTM E1155 analysis has traditionally been carried out using a specialist device that is walked across the floor, along predetermined measurement lines that follow the guidelines in the standard in terms of where they are placed. The device is a very precise 1 foot baseline that is equipped with very precise tilt sensors that determine the difference in elevation between successive points along the survey lines. The standard requires that a minimum number of precise elevation points must exist on each survey line in order to contribute to the calculations. The ASTM standard requires a uniform distribution of survey lines over the surface, and requires a minimum number of contributing points to the analysis based on the area of the surface being analyzed. The survey lines must be at approximately 45 degrees to the main building walls, and on large floor areas must exclude a 2 foot boundary area around the floor edges, and around piers and columns etc.
In today’s measurement world, precision scanners are now being used to scan the floors after construction, and the requirement is to perform the ASTM analysis on the scan data and provide the same ASTM E1155 reporting from the scan data in place of using the ASTM measurement device.
The RPS QA Floors command provides the tools that convert scan data into ASTM reports using the following steps
- Create the floor outer boundary
- Offset the floor outer boundary by 2 foot inside the boundary line
- Create the line layout using the automated layout tool. We recommend using the Grid method for the analysis, however line and walk modes are also supported.
- Import the scan data for the floor, clean up the scan data to remove data not related to the floor itself to create a Point Cloud Region for the floor for the analysis.
- Run the analysis computations, typically on more survey lines than are required by the ASTM standard and review the results. Make any adjustments to the selected survey lines to optimize the results generated and ensure that the results generated meet the specifications for the floor construction.
- Generate the final report deliverable in PDF or Excel output format.
You can also use standard TBC functionality to create a surface model from the scan data for the floor and compare the surface to the design surface model to generate a Cut / FIll heatmap for the floor under analysis. The heatmap can also be contoured at tight intervals to display any surface variations / distortions that may be present.
For floor areas with complex shapes, you can break the floor area up into rectangular sections and then analyze each section individually, the sectional analyses can be combined into a total floor analysis in the final reports that will be generated.
Note: The benefit of this analysis tool is that you can carry out more analytics on the floor than are practically possible with the traditional methods to ensure that the surface has high quality of construction to meet the most stringent standards. The processing is extremely quick and the reports are of exceedingly high quality.
When should we scan the floor area after concrete has been poured?
The floor scan should be carried out as soon as possible after concrete pour has been completed, typically scan the surface after 24 hours and before 72 hours have elapsed.
Command Interface Description
The QA Floor command dialog looks as follows
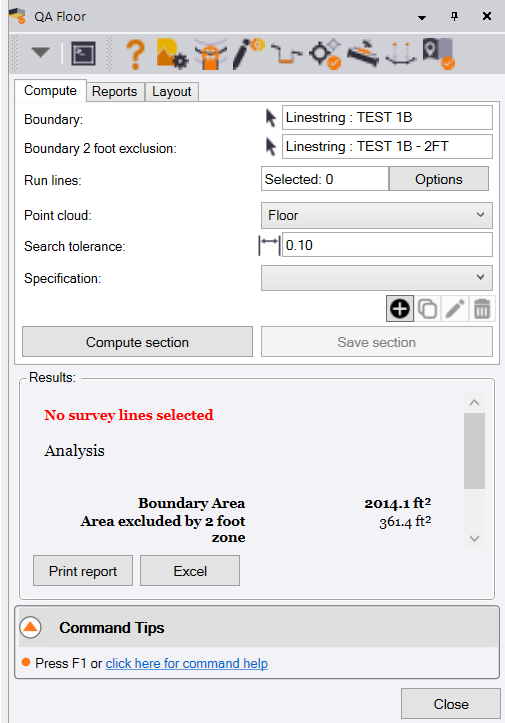
There are 3 tabs in the dialog which provide the following 3 Steps of the process
- Layout - Create the survey lines for the analysis
- Compute - Computes the ASM E1155 Analysis
- Reports - Generates the final reports in PDF and Excel format
Layout Tab
Before you can compute the layout, you need to create the floor area(s) (Boundary line) and the 2 foot offset lines (Boundary 2 foot exclusion line) for the floor areas. Use standard TBC CAD tools like Create polyline, break, extend, join, track region outline to achieve that.
Start in the Compute Tab and select the Boundary line and the Boundary 2 foot exclusion line.
Now select the Layout tab of the command. The Layout dialog looks as follows
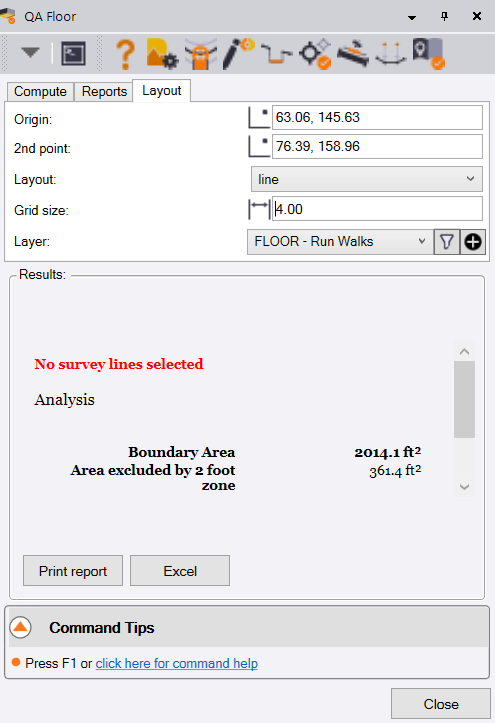
Layout
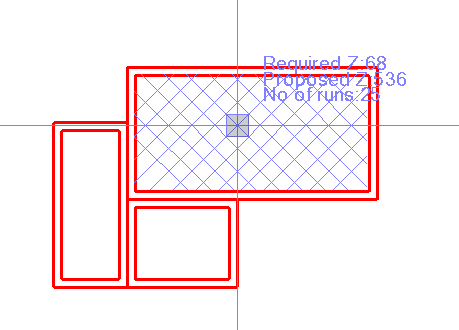
Select the layout style that you wish to use, we recommend the Grid method because that automatically creates grid lines going in two directions at a defined spacing across the entire selected area, and checks that you are meeting the minimum requirements of the ASTM standard. The options include
-
Grid - creates an orthogonal grid at 45 degrees to the main axes lines of the selected area and eliminates grid lines that would be too short for the overall analysis. The tool reports the minimum number of required Z values as well as the actual number of Z values that will be created by the computed grid as you move the cursor over the area to be analyzed. The grid is dynamically updated as you move the cursor over the area to be analyzed.
-
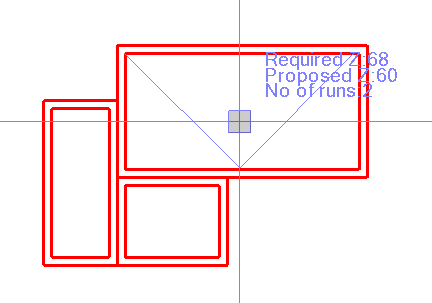
Walk - Creates a Walk Line across the selected area that crosses back and forth at 45 degrees to the main axes of the selected area. The tool reports the minimum number of required Z values as well as the actual number of Z values that will be created by the computed walk line as you move the cursor over the area to be analyzed. The walk line is dynamically updated as you move the cursor over the area to be analyzed.
-
Line - Creates a single line at 45 degrees to the main axes of the selected area that crosses from a selected location to a second selected location on the selected boundary lines.
Note that if the 2 foot exclusion area exceeds 25% of the total area to be analyzed, the 2 foot boundary line is automatically ignored as per the ASTM standard.
Grid Size
Enter the grid size (spacing) that you wish to use for the Grid mode of layout calculation. Note that the tighter the spacing, the more analysis that will be computed, however the ASTM standard only requires that you meet the minimum coverage criteria, so while you can rapidly create a more detailed assessment of the entire floor area, the computation volume can easily exceed the requirements of the ASTM standards. It is good practice to analyze the entire floor area in detail and then use that analysis to select the final settings and run lines that will be used for the final analysis and reporting.
Layer
Select the layer on which you want to draw the survey run lines that you are creating. You can use the New Layer control to create a layer if you don’t have one already prepared, there you can also create a Layer Group also if needed. We recommend that you add the following Layers to your Project Template for this type of work
QA FLOOR - Annotation
QA FLOOR - Heat Map Contours
QA FLOOR - Heat Map Labels
QA FLOOR - Lines - 2 Foot Offset
QA FLOOR - Lines - Boundary
QA FLOOR - Run Lines - Line
QA FLOOR - Run Lines - Grid
QA FLOOR - Run Lines - Walk
You can create a QA FLOOR layer filter in your LayerFilters.rps file in your RPS Settings folder and then use that filter here to rapidly access just the QA FLOOR layers above.
Origin
As you move the cursor over the area of analysis defined by the boundary lines, you will see a dynamic grid displayed. The dynamic grid updates automatically as you move the cursor over the area, and directly provides the minimum number of Z values required as well as the number of Z values that will be created with the currently displayed grid configuration. You can reduce the number of Z values in the analysis by changing the grid size value.
Creating a Grid
Creating a Walk
Creating a Line

2nd Point
When you define a Line type run line, you will be asked for a first (the origin of the line) and second point (the end of the line). In this case you will click near the boundary line for each of the two points to create the run line.
To create multiple Grids, Walk Lines or Lines for the analysis in the same area you can simply repeat the processes above. If you wish to create these for multiple areas, for each area, you will need to select the Compute Tab, select the Boundary line and the 2 Foot offset line and then re select the Layout tab and repeat the above steps.
Compute Tab
Having created the run line layout, you are now ready to carry out the computation and analysis of Floor Flatness and Levelness.
Boundary:
You will have already selected the floor area or floor section boundary. If not you can select it now. Pick the outer boundary of the floor area.
Note: We recommend that you name the boundary for reporting purposes, you can do that from the properties pane.
Boundary 2 foot exclusion:
You will have already selected the 2 foot exclusion area boundary for the floor area or floor section. If not you can select it now. Pick the 2 foot exclusion boundary for the floor area.
Run lines
Select the run lines that you created for the floor area in the Layout Tab process.
Note: We recommend that you name the run lines that you created for reporting purposes. If you have a large number of lines to name, you can do that using the RPS Affix Name command from the RPS Data Prep menu
Point Cloud:
Select the point cloud region for the floor area under analysis.
Search tolerance:
For the analysis, points are created every 1 foot along the run lines. To create a good assessment of the elevation at each 1 foot point, the command analyzes data within a small square around each of the 1 foot point. The search tolerance defines the length of the side of the square e.g. if you enter 0.1’ then it will analyze all of the points in the point cloud in a small square that has 0.1’ x 0.1’ dimensions. The analysis takes a mean value of all the points in the square, it also reports how many points were analyzed and what the min and max values were in the analysis for each point.
Specification
You can define as many specifications for the analysis as you need. Click the [+] key to create a new specification, the copy button to create a copy of an existing specification, the edit button to edit the selected specification and the delete key to delete a specification.
These are industry standard specifications
| Standard | FF Value | FL Value | Min FF | Min FL |
|---|---|---|---|---|
| Moderately Flat | 25 | 20 | 20 | 15 |
| Flat | 35 | 25 | 30 | 20 |
| Very Flat | 45 | 35 | 40 | 30 |
| Super Flat | 60 | 40 | 55 | 35 |
Note: The higher the FF and FL values the flatter and more level the floor being analyzed.
When you create a new specification, the following dialog is presented
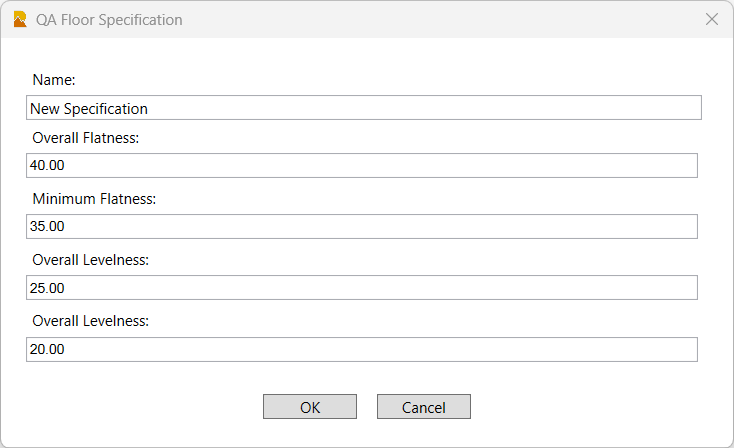
Name:
Enter a name for the specification
Overall Flatness:
Enter the target FF value for the floors overall flatness from the project specifications.
Minimum Flatness:
Ener the Minimum Flatness FF value for any single run line that is acceptable to the project specifications.
Overall Leveless:
Enter the target FL value for the floors overall levelness from the project specifications.
Minimum Levelness:
Ener the Minimum Levelness FL value for any single run line that is acceptable to the project specifications.
OK:
Click OK to complete the specification definition.
Cancel:
Click Cancel to close the specification definition dialog without saving.
Note the specifications defined here are stored in the RPS Settings folder in a settings file called RPSQAFloorSettings.rps.
Compute section:
When you analyze the whole of a concrete floor or a section of a concrete floor, once you have the settings and specifications defined / selected, the results section presents a summary of the data under analysis similar to that shown below
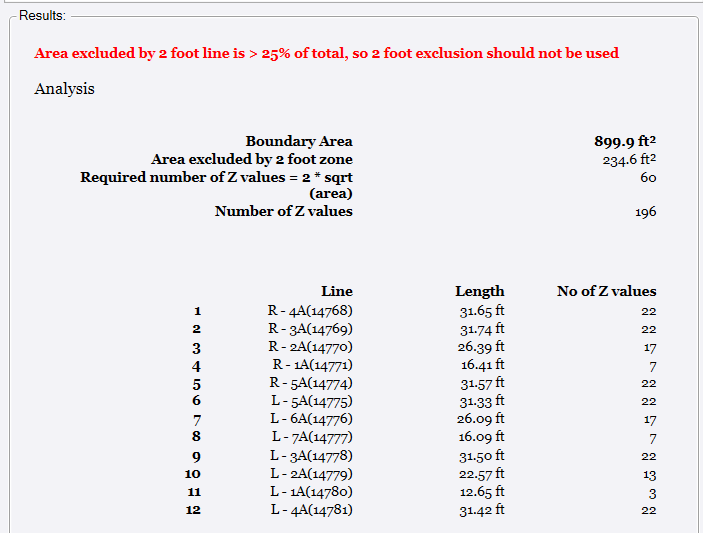
Any warning or notification will be highlighted in red text - in the example shown, it states that the area between the outer boundary and 2 ft exclusion area boundary exceeds 25% of the total area under analysis and that the exclusion boundary will be ignored as a result (as per the ASTM E1155 standards).
The boundary area is shown, along with an assessment of the minimum number of Z values required by the analysis and the actual number of Z values that will be created by the analysis. It then breaks out the Z value numbers by run line as a reference before you execute the computations.
When ready to compute, click the Compute section button.
The results of the analysis will be presented as tables and graphs in the Results section of the dialog. The computation and report generation can take a few seconds to execute depending on the size of the area being analyzed and the number of run lines selected.
Report Review:
The report for the analysis is generated in the results section. The report contains summary and detailed tables as well as graphs that display the results for each run line. AT the start of the report you will find the header details as shown below.
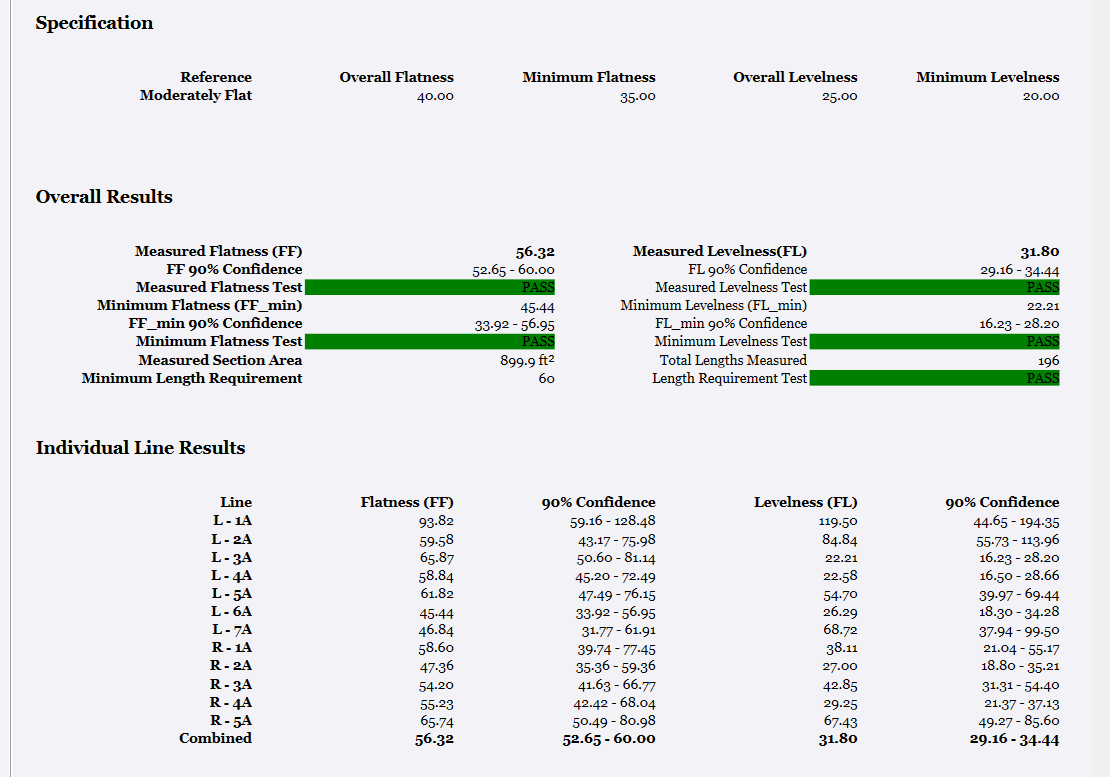
Specification details:
This area reflects the specification that was selected for the analysis.
Overall results:
This section of the report provides the overall analysis for the floor section including the Pass / Fail state for each of the key metrics
- Measured flatness (FF) value - this is the FF value for the entire floor area
- Measured levelness (FL) value - this is the FL value for the entire floor area
- FF 90% confidence - this the range of FF values that are within the 90% statistical confidence range for the analysis.
- FL 90% confidence - this the range of FL values that are within the 90% statistical confidence range for the analysis.
- Measured Flatness Test - shows whether the achieved FF values passed or failed when compared to the specification definition.
- Measured Levelness Test - shows whether the achieved FL values passed or failed when compared to the specification definition.
- Minimum Flatness (FF_min) value - this is the lowest FF value on any of the run lines assessed.
- Minimum Levelness (FL_min) value - this is the lowest FL value on any of the run lines assessed.
- FF_min 90% Confidence - this the range of FF_min values that are within the 90% statistical confidence range for the analysis.
- FL_min 90% Confidence - this the range of FL_min values that are within the 90% statistical confidence range for the analysis.
- Minimum Flatness Test - shows whether the achieved FF_min values passed or failed when compared to the specification definition.
- Minimum Levelness Test - shows whether the achieved FL_min values passed or failed when compared to the specification definition.
- Measured Section Area - This is the total area of the floor that was analyzed
- Total Lengths Measured - This is the number of Z values that were measured in the analysis
- Minimum Length Requirement - This is the minimum number of Z values required for the area being analyzed
- Length Requirement Test - shows whether the minimum number of Z values analyzed passed or failed the minimum requirements.
Note if all the tests pass, the floor flatness and floor levelness requirements were met based on the run lines analyzed. The ASTM E1155 standard requires that you meet the minimum analysis requirements only, there is no need to analyze more detail than the standard requires to achieve a pass state. Having said that, this analysis is so fast and provides greater comfort that your constructed surface meets and exceeds the specifications of the project.
Individual Line Results Table
This table captures a summary of the results for each of the run lines analyzed for the FF and FL values along with the 90% Confidence value range. At the base of the table, the combined values are displayed which constitute the overall analysis for the floor section being assessed.
Run Line Analysis:
A detailed analysis is performed on each run line selected. Each run line generates its own section of the report as per the example shown below.
Graph of run line analysis
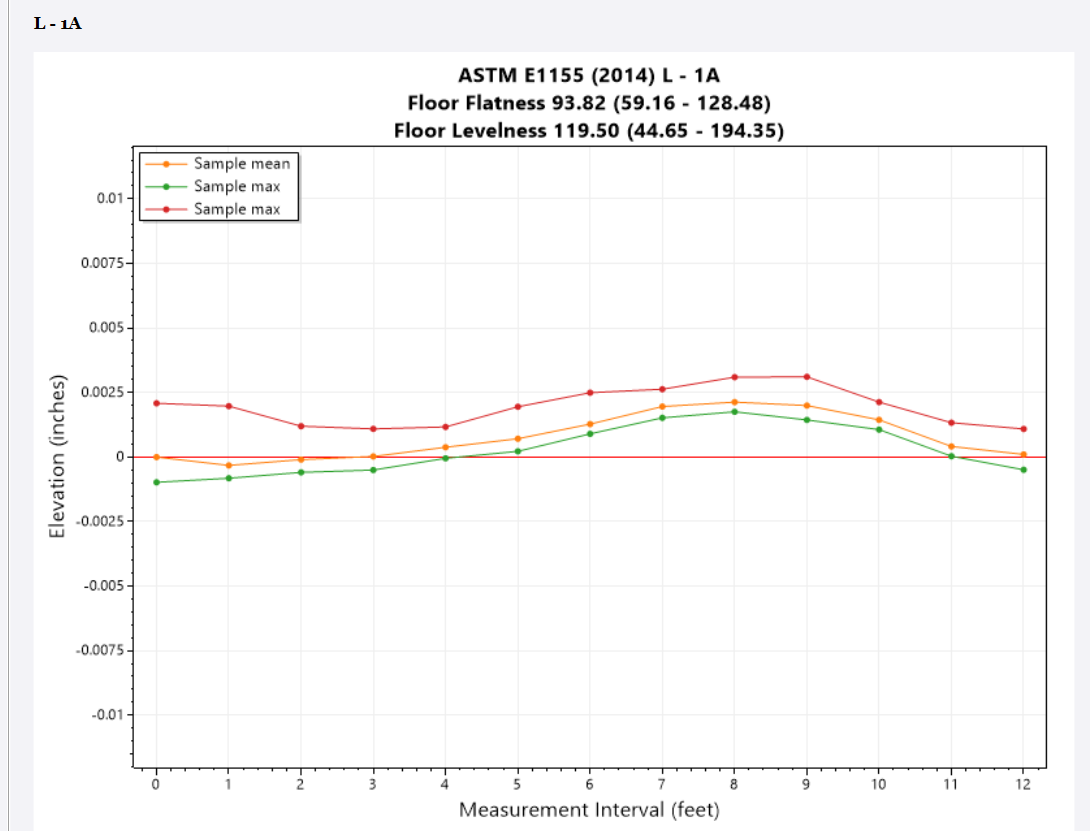
Run line tables
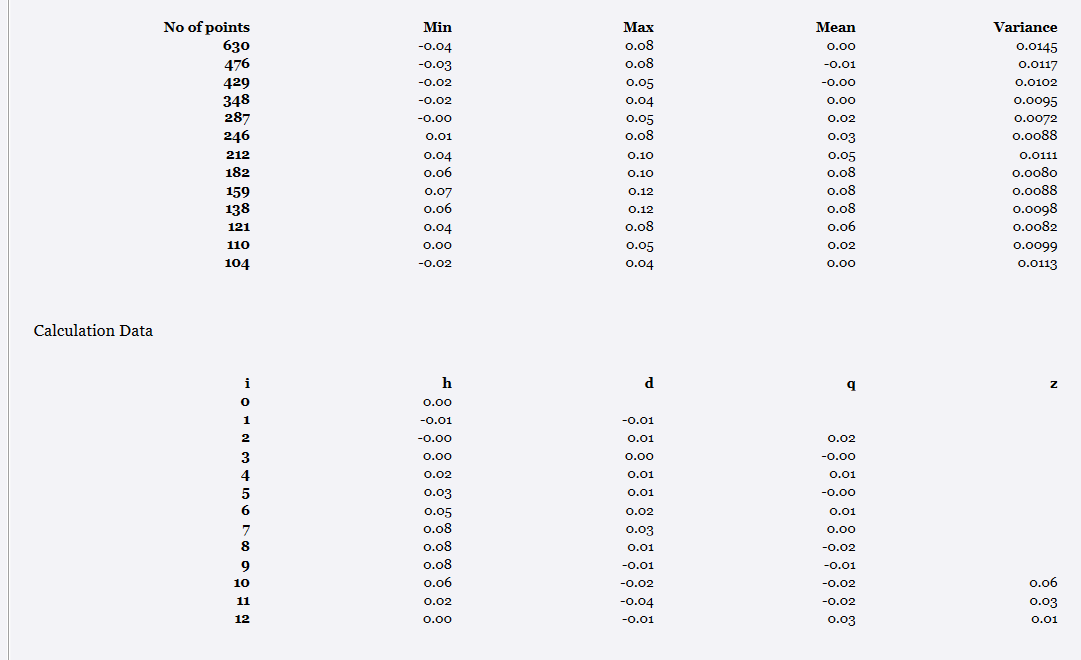
For each run line there are two tables of results.
The upper table shows for each point analyzed along the run line, how many points were sampled at each Z value location, the minimum, maximum and mean value of the points analyzed and the variance (an indication of the spread and quality of the location).
The lower table are the key values that have to be reported for the ASTM E1155 standard reports including the “i”, “h”, “d”, “q” and “z” values for the points on the run line.
For a detailed explanation of the values and what they mean / how they are used in the analysis we refer you to the ASTM E1155 standards documentation.
Save section:
When the computations have been completed, and you have made any needed adjustments and re run the calculations to your satisfaction and you are ready to commit the results to the final analysis, click the Save section button and complete the details for the final report. The following dialog will be presented
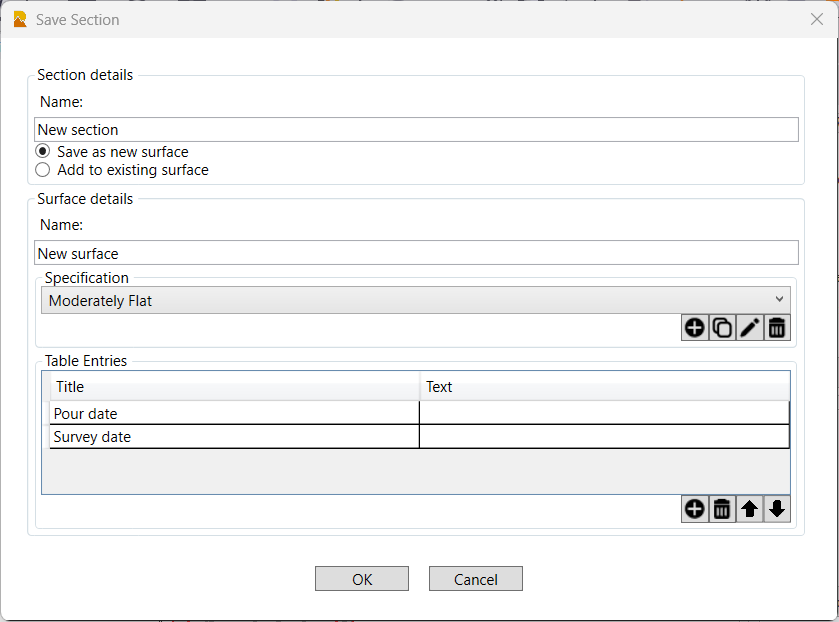
Name:
Enter the name for the section that you have analyzed.
You can elect to save the section as a New surface or add the section to an Existing surface. If you have broken the floor area down into sub areas / sections, as you analyze each section, you will add the results to the analysis for an existing surface (created when you analyze the first section of the floor area).
Surface details:
Name:
Enter the name for the new surface if you elected New surface above. If you elected Existing surface above then select the surface from the list of analyzed surfaces presented.
Specification:
Select / confirm the specification that was used for the surface analysis from the available specification options. You can create, copy, edit and delete specifications here if needed.
Table Entries:
Complete the Table Entries that you wish to add to the final report. You can Create, Delete and change the order of the created entries. For example you may want to capture the Pour date for the concrete and the Survey date for the scan survey that was carried out. The entries that you create here will appear on the final report.
OK:
Click OK to complete the section analysis
Cancel:
Click Cancel to close the dialog and not save any changes that you made.
Print report:
To print the report to a PDF (.pdf) file, click the Print report button. An example report can be downloaded below as a reference.
MSM 312 Bunker FF FL Report.pdf (1.3 MB)
Excel:
To print the report to a Excel (.xls) file, click the Excel button. An example report can be downloaded below as a reference.
MSM 312 Bunker FF FL Report.xlsx (435.4 KB)
Reports Tab
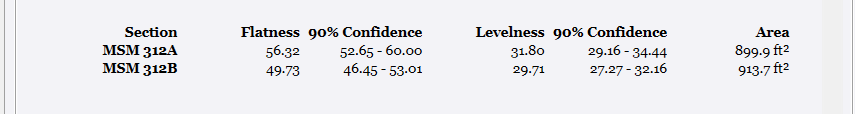
While the computation tab creates the FF FL reports for each individual floor section that you analyze, if you need to bring multiple floor sections together for a large irregularly shaped floor report, you can do that in the Reports tab. This report is identical to the report described in the Compute Tab section of this documentation, with one exception in that this report is now divided into the scan sections of the floor and then into the run lines within that section and that there is now a header section that displays all of the sections that were analyzed to create the overall floor analysis. The header area also contains the Table Entries that you added o the reports.
Table Entries Header

Section Summary Header
Print report:
To print the report to a PDF (.pdf) file, click the Print report button. An example report can be downloaded below as a reference.
MSM 312 Bunker Report - Total Area.pdf (2.4 MB)
Excel:
To print the report to a Excel (.xls) file, click the Excel button. An example report can be downloaded below as a reference.
MSM 312 Bunker Report - Total Area.xlsx (829.3 KB)
Header bar commands:
In the header bar of the command you can find icon buttons that link you to other commands that you may find helpful while running this command. The header bar commands include
- Help
- RPS Settings
- Takeoff Lines
- Smart Edit
- Adjust Linestring Elevation
- QA Points
- QA Lines
- QA Road Lines
- QA Notebook
Close:
Closes the command without further execution.
Use Case Videos
The following videos show the use of the QA Floor command in a work process context
Feedback and Enhancement Requests
If you would like to provide feedback on the use of the QA Floor command or to request enhancements or improvements to the command please click Reply below.