Cloud Services - Analyze Surface Areas by Slope range

Functional Overview
The Analyze surface areas by slope range command reviews the slope and slope direction of all triangles in a selected surface model. It can optionally divide the triangles into two groups
- Triangles that slope downhill to the North or triangles that slope downhill to the South
- Triangles that slope downhill to the West or triangles that slope downhill to the East
- No grouping based ion slope directions of the triangles
The triangles are then sorted into slope ranges defined by the user e.g. from 0-5%, 5-10%, 10-15%, 15-30%, 30-45%, 45-100%, 100-10000% etc. and assigned color shading to indicate both their Nort, South, East or West slope directions, and the slope range band that they fall inside.
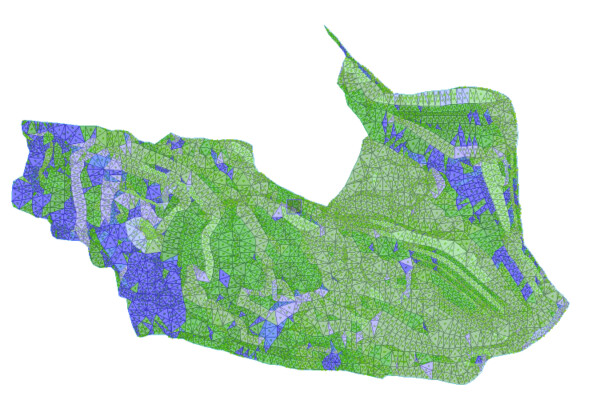
The colored triangles are then returned to TBC as shaded 3D faces that overlay the original surface model.
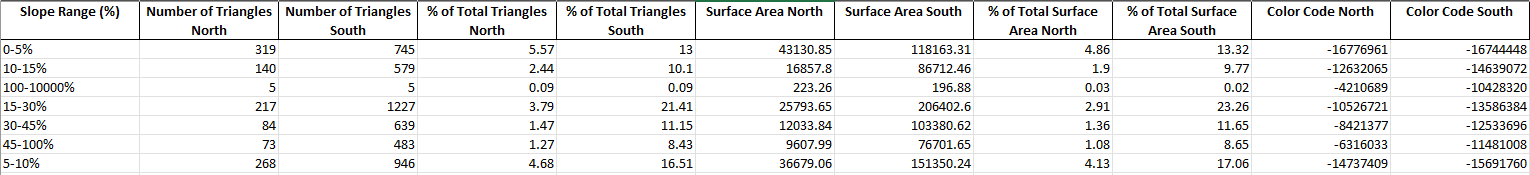
An Excel report is also generated that provides all key metrics for the triangles analyzed, including % of Surface in each slope band, surface areas of each slope band etc.
The 3D faces are also created in a DX file for use in other products.
This is what the end result looks like
Release History
July 2025 - Version 1 released
Video Demonstration
The following video shows you how to use the command
Command Inputs
The command dialog when filled out looks like this
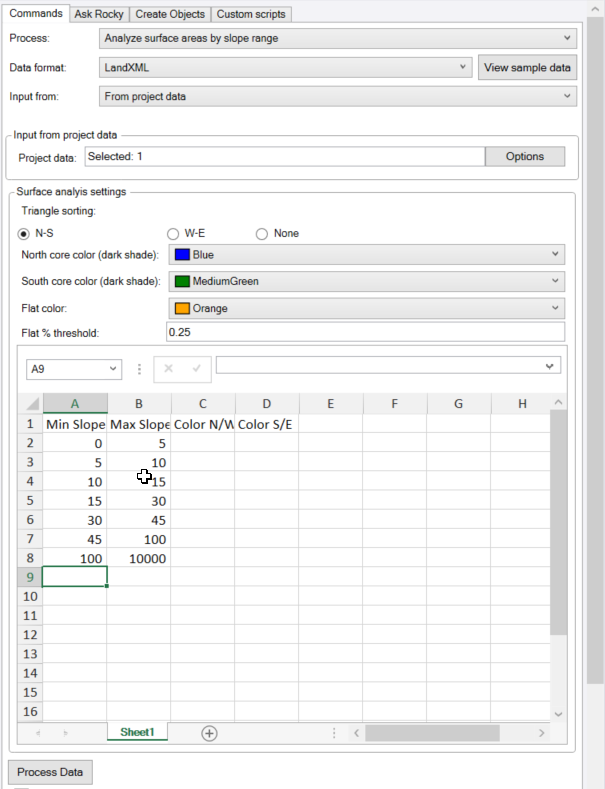
Process
Select the Analyze surface areas by slope range process.
Data format
The format that the data is delivered in to Cloud Services is LandXML. You can deliver the data through selection of a file in LandXML format, or you can select a surface model in TBC graphics which will be written out as a LandXML file to the processor.
Input from
Select either
- From file
- From project data
When you select from file, use the Attach file button to browse for and select a LandXML file generated by the TBC application. Note there are many variations of LandXML format, only the TBC definition is currently supported. We recommend that you import the LandXML into TBC first, then select the surface graphically using the From project data option.
When you select From Project Data, select the surface that you wish to analyze from the TBC Plan or 3D views or from the TBC project Explorer - Surface section.
Surface analysis settings
Triangle sorting
Elect one of the 3 options for Triangle sorting
- N-S - Separates the triangles into those that slope downhill to the North or to the South. North is defined as from 270 to 90 degrees in a clockwise fashion. South is from 90 to 270 degrees in a clockwise fashion.
- W-E - Separates the triangles into those that slope downhill to the West or to the East. West is defined as from 180 to 0 degrees in a clockwise fashion. East is from 0 to 180 degrees in a clockwise fashion.
- None - does not separate the triangles into direction groups, only slope range groups.
North or West or general Core color (dark shade)
Set the core color for this direction facing triangles. If you e.g. select Dark Blue, the slope ranges will be colored in Blue Shades from Dark Blue to Light Blue with decreasing slope %.
South or East Core color (dark shade)
Set the core color for this direction facing triangles. If you e.g. select Dark Green, the slope ranges will be colored in Green Shades from Dark Green to Light Green with decreasing slope %.
Flat color
Set the color to be used for flat triangles that have either 0% or a slope up to a defined Flat % threshold value e.g. 0.25%
Flat % threshold
Set the Flat % threshold value e.g. 0.25% below which all triangles will be colored in the selected Flat color.
Slope Input table
Enter just the Min and Max slope % values for each color band range that you require. For example set the following
| Min Slope % | Max Slope % |
|---|---|
| 0 | 5 |
| 5 | 10 |
| 10 | 15 |
| 15 | 30 |
| 30 | 45 |
| 45 | 100 |
| 100 | 10000 |
Process Data button
When you have made your selections and input the settings required, click the Process Data button to execute the calculations. On completion the 3D face representations of the triangles will be displayed in the Plan and 3D views. The triangles are separated into layers that are named
SLP - Surface Name - North 0-5% for example. the layers will be found in Layer Group 99M - SLOPE ANALYSIS.
Note that the faces will always displayed with 100% transparency, to show them colored, select the faces and set the transparency value to e.g. 50%.
Command Outputs
The command in addition generates a DXF file that also contains the colored 3D faces, named for example TriangleSlope_W-E_Existing_Ground.dxf
The command also generates an Excel Spreadsheet report that contains an analysis of all the triangles