PDF Manager Command

Command / Process Description
The PDF Manager command provides a complete workflow for importing, reviewing, georeferencing (Placement and Scale), intelligent data extraction, image extraction, and relocating the PDF images and all associated project data when real coordinates for a project are made available.
The Data Extraction process for creating linework and text objects from the PDF data was significantly enhanced in the 2026.10 release of the RPS Command Library. The new process provides a more selective approach to the data extraction, improved control over the joining of dashed linework and a smarter way to organize the extracted data into your standard target layers all in a single step process.
Command Location
The PDF Manager Command is licensed to the RPS Smart Suite and RPS Smart Data prep Command Library
- The PDF Manager Command is located in the PDF group of commands on the Smart Suite and Smart Data prep menu ribbons
Release History
Dec 2025
The data extraction process for PDF Manager was significantly enhanced, and moved over to RPS Data Extraction methods in the RPS 2026.1 release of the Command Library. A number of aditional enhance,ents to the Review process were also added at this time including a new faster, more comprehensive PDf Review toolkit.
Video Demonstration
The following video provides a quick overview of the Smart Plot Command
To Follow
The following video shows you how to use the Data Extraction tools of the PDF Manager command.
Command Interface Description - Data Extraction Process
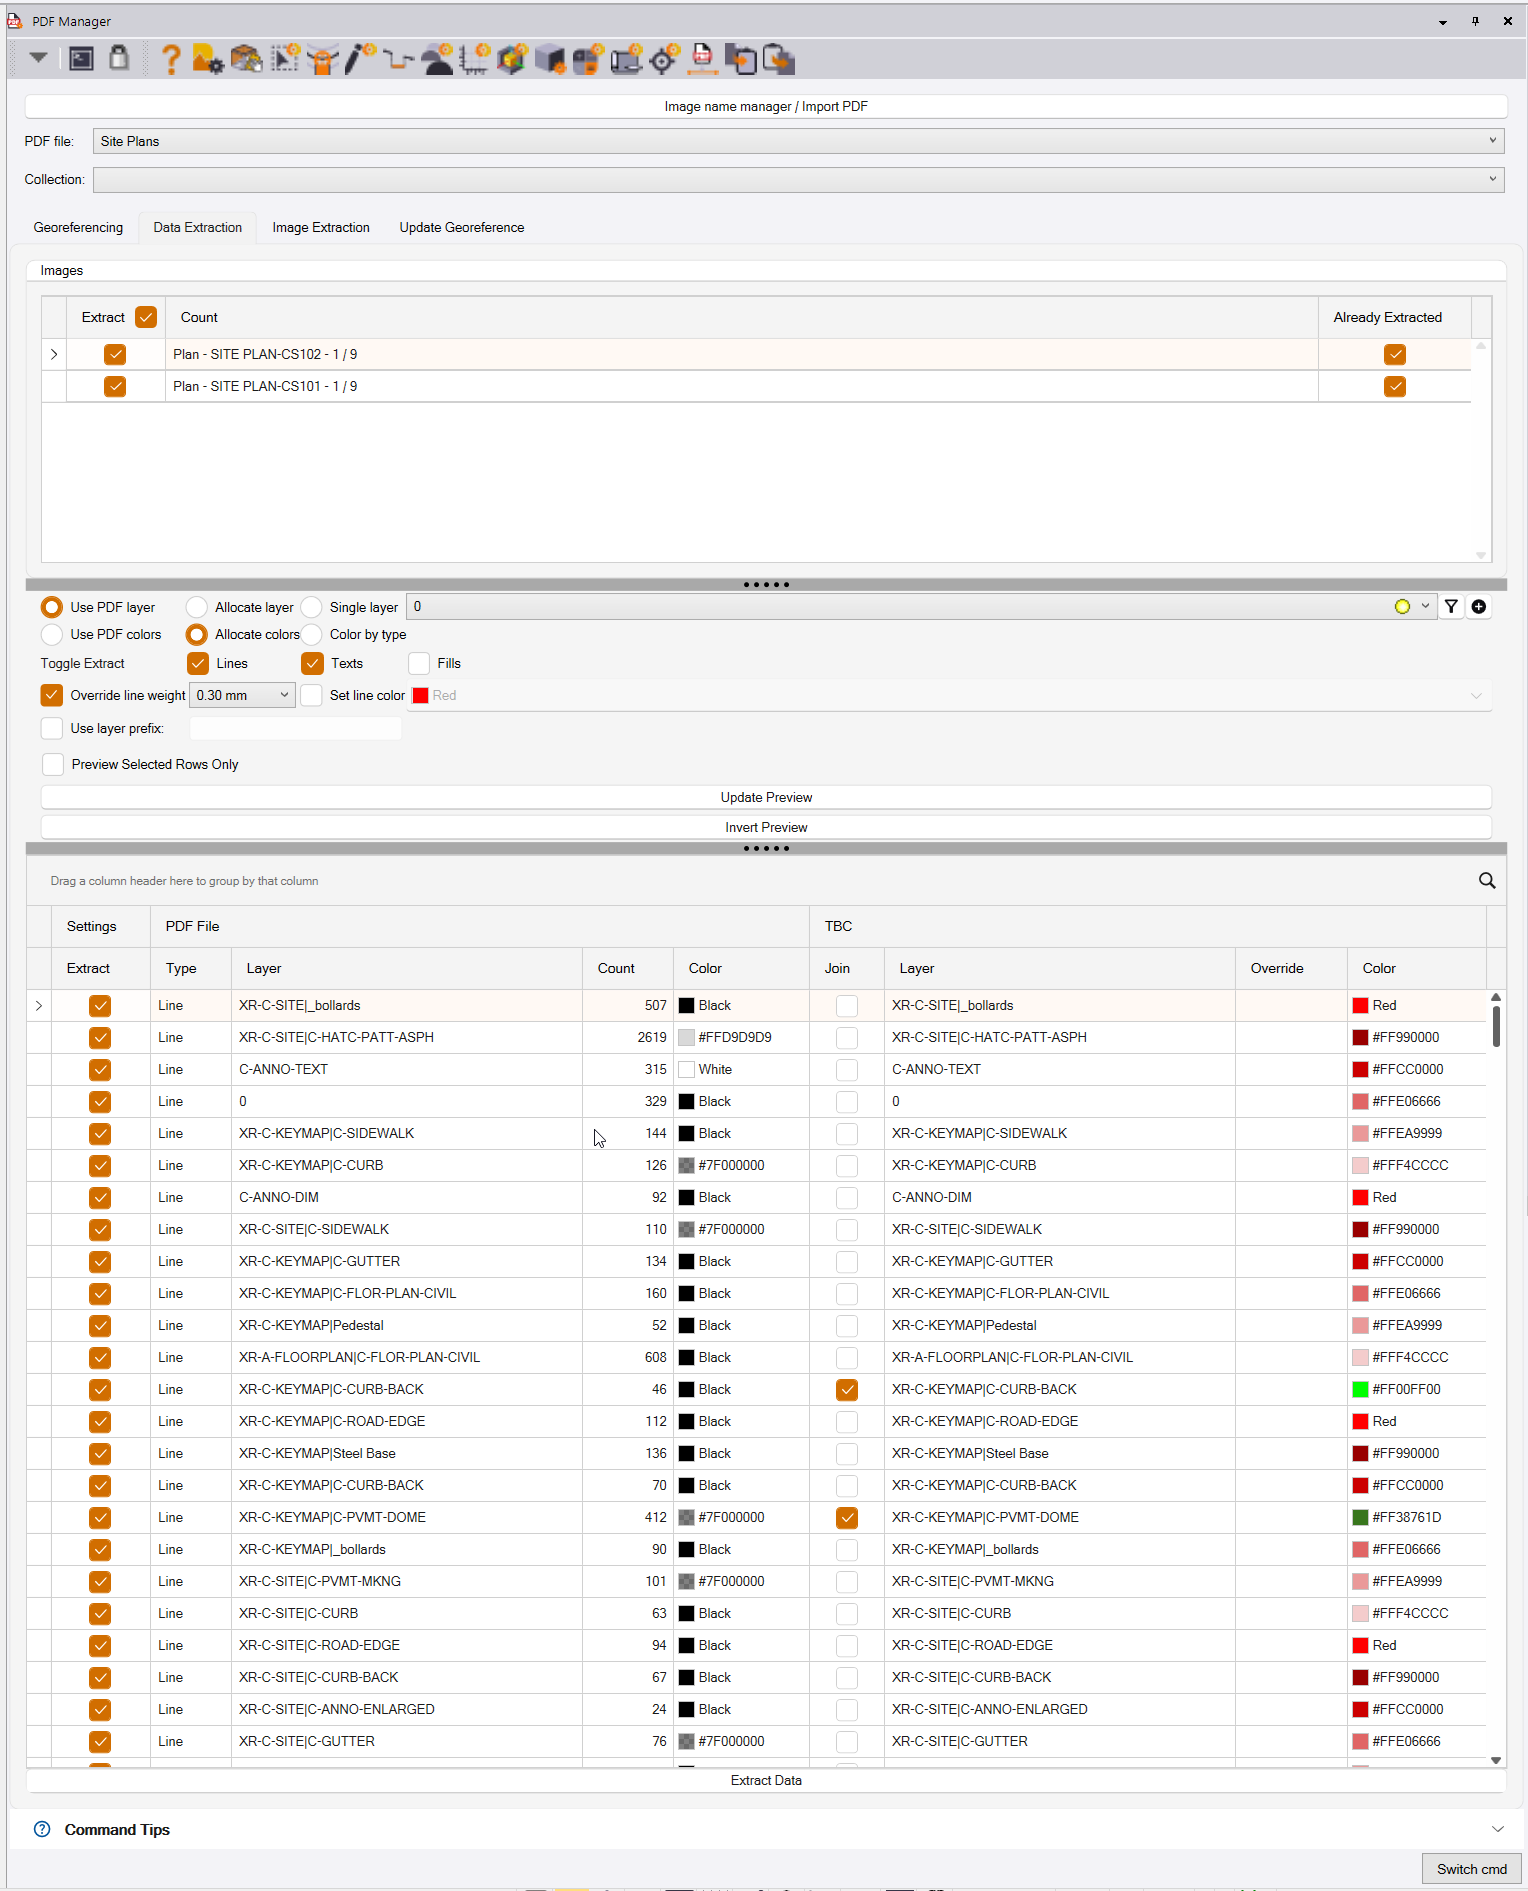
The PDF Manager, Data Extraction process command dialog looks as follows
Preparatory Steps
Image Name Manager / Import PDF
When you first run PDF Manager in a new project, you will be asked to select a PDF File that you want to work with. You will browse your PC to find the PDF File, select it and then it will open in the PDF Manager Review pane. Here you can organize PDF Pages into Page Collections (or it will automaticaly use PDF Bookmarks that are set up in an appropriate manner), Name PDF Pages, and review the contents of the PDF File to familiarize yourself with the plans.
This button in the PDF Manager command dialog, provides the ability to go back to this review pane, to select additional or new revision PDF files, and to update page collections or page names as needed to meet your project needs.
PDF File
Select the PDF File that you wish to work with in this process. If you have loaded multiple PDF files, either for different aspects of the project (Existing, Erosion Control, Grading, Phasing etc.), or for different revisions of the design, multiple options will be listed in this pull down.
Collection
Inside each PDF file, during the Review process, you will have organized the pages of the PDF into Page Collections eg Pages 41-55 are the Grading Plans, 83-122 are the Cross Sections etc. Select the page collection that you want to extract the data from. Note that the pages of a PDF file first have to be Georeferenced before data can be extracted from them. Georeferencing involves using one of 3 methods to place, scale and rotate the PDF sheets so that they are scaled and positioned correctly for the project.
Data Extraction Tab
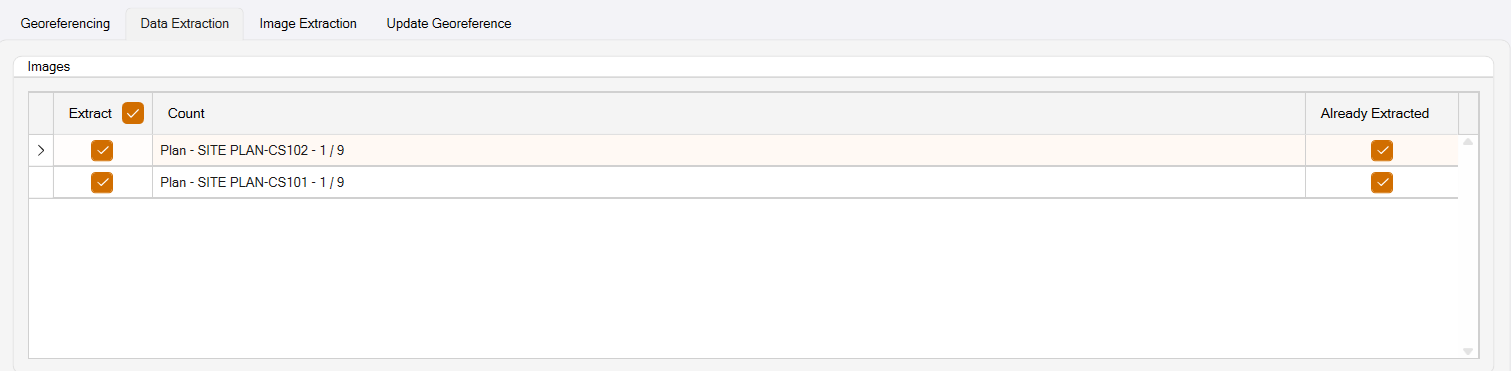
Once the pages have been Georeferenced, you are ready for Data Extraction. Click the Data Extraction tab of the command dialog to start this process.
If you have previously extracted data from the PDF pages, they will be marked as shown below - Already Extracted Checkbox is enabled.
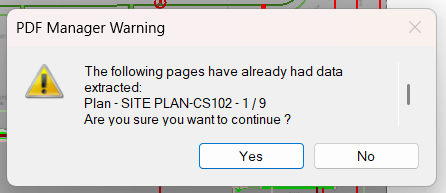
If you want to re extract the data, simply click on each page from which you want to re-extract data from, you will be shown this prompt, click Yes to continue or No to abort the process.
Whether you are starting the data extraction process for the first time, or re extracting data because you made a mistake and want to start over, from here the process is the same.
Primary Settings For Data Extraction
Use PDF Layer / Allocate Layer / Single Layer
There are primarily 2 types of PDF, Raster (Image Only) and Vector (contains linework, fills and text data that can be extracted).
The Vector PDFs contain line and text data that can be extracted. There are primarily two types of Vector PDF file.
Flattened PDF
The first type is what is termed a Flat PDF - it was “flattened” by the CAD software that generated it, so that all of the data in the PDF is basically on a single layer in the file, i.e. different features all live in the same layer space, which makes it harder for you to work with.
In this case however there are some things that we can do to help you.
The file will contain 3 types of data - lines, text and fills. We use this as a primary filter to separate the different types of data into separate layers and layer groups.
Linework in the file can further be separated into Solid Lines and Dashed Lines. Those can be further separated into lines of different lineweight (line thickness) and also into lines of different color (colors or grayscales).
Text can be separated by Font type and also Text Height. Some text label types will use a different font type and different size of text, depending on the lavbel / annotation in question.
In this way, while not perfect, we provide you with a way to separate the vector PDF data into logical groups, each group is placed on a different layer, can be assigned a unique color, and will be placed in a layer Group for Text, Solid Lines, Dashed lines or “Other Data”. Other Data is data that during the data review process (outlined below) you determined to be less useful, so it is triaged off into its own layer group in case you missed something on that layer that was actually important.
When you have a flattened PDF, you can tell from the Preview pane, by looking at the left side of the preview pane, in the PDF File layer column. If the names start with PDF then these are names that we allocated to the data type, because it was a Flat PDF, if the layer names are somewhat meaningful, then you are working with a layered PDF (see below).
When working with a flattened PDF, you should select the Allocate layer option. In most cases this will be the correct option.
Layered PDF
The second type is what is termed a Layered PDF file. These are the best you can get, can be a little less common, but are becoming more and more available. These contain a layer structure that is the same as the source CAD file that was used to generate the PDF file. Data in these files is better organized, because it matches the way that the engineer was working with the data. In this case, there is less / no need to separate the data into differemt layers, however we still have to analyze the data on each layer and split it out by Solid Line, Dashed Line and Text, so that we can help you to more rapidly process and work with the extracted data.
If the PDF has Text for things like Elevations, Cross Section Station or Grid labels then you have all the basics that you need to carry out a takeoff or Data prep on the PDF data. Often however, PDF files can have what is termed Polyline Text rather than real text, and that is just linework that looks like text. This linework ends up on layers and can be mixed in with real linework. Polyline Text is pretty much useless, and just slows down the overall process. If you have real text, that is used in our Cross Section conversion process as well as in the data prep process, so it is worth keeping and organizing in the same way as you organize linework. There will also however be a lot of other text including annotations, text blocks, title box information, dimensions etc, that have no real use in the data prep process. These again can be triaged off as “other data” so that you reduce the amount of work for yourself downstream.
When you have a layered PDF, you can tell from the Preview pane, by looking at the left side of the preview pane, in the PDF File layer column. If the names start with PDF then these are names that we allocated to the data type, because it was a Flat PDF, if the layer names are somewhat meaningful, then you are working with a layered PDF.
When working with a layered PDF, you should select the Use PDF layer option. In most cases this will be the correct option.
Single Layer Option
In some scenarios eg when you are comparing two different revisions of plans to identify changes between Rev 1 and Rev 2 for example, it can be advantageous to extract all of the data from the PDF on a Single Layer and to apply a single line color to all of the data that is extracted (See Set line color below).
In this way you can place all your Rev 1 data on a layer called Project Rev 1 and set the color to e.g. Blue, and the place all your Rev 2 data on a layer called Project Rev 2 and set the color to e.g. Red.
If you then use Layer manager to set the Display Priority for the Rev 1 layer to Foreground and the Rev 2 Layer to Background, where Rev 2 is different / new in the comparison, you will see Red linework clearly. These will be additions or location changes between the Rev 1 and Rev 2 data.
If you reverse the display priority of the layers so that Rev 1 is now background and Rev 2 is now Foreground, any Blue linework that you can see is linework that was in Rev 1 and is no longer there in revision 2. These will be removal or location Changes between Rev 1 and Rev 2 data.
In each step if you relayer the datta that you have identiied as removed, added or changed, you will have identified all of the modifications between the revisions for the project so that you ca incorporate those changes into your model updates / takeoff updates.
Select the layer on which you want to place the extracted PDF data. If you need to create a new layer, use the buttons at the right end of the layer selector to create a New Layer.
Use PDF Colors / Allocate Colors / Color by Type
PDF files can be Black / White / Greyscale (typical) or in some cases can include color. If the PDF is colored then you may want to preserve the PDF colors in your TBC data extraction process. In this case select the Use PDF colors option.
If the PDF is Black / White / Greyscale, it is hard to differentiate features of differet types, and also to determine which lines go together e.g. Existing Contours, Finished Grade Contours, Curb or Buiding pads etc. In this case, colorizing the PDF is a good option, in this case the colors are assigned to the Solid Lines (Shades of Red), Dashed lines (Shades of Green), Text (Shades of Blue), Fills (Cyan).
Note that designers often used dashed lines to represent existing features, solid lines to represent design / proposed features etc. so we leverage this to try and provide a simple graphical delineation between the two types of line.
Typically Fills have little to no use in the Data Prep / Takeoff workflow. Typically Text can be helpful for Cross Sections workflows as well as 3D Data Prep and Takeoff procedures.
Colorizing the PDF makes it instantly more understandable, because features of the same type will have the same color, and can be seen collectively as a grouo and also as individual lines.
Toggle Extract - Lines, Texts, Fills
The PDF files will typically contain vector daa of the three main types - those being Lines 9Slid or Dashed), Text lavbels and Annotations, Fills (Shading and Hatch patterns applied to areas of the project).
Typically Fills can be disabled (default behavior), if you find that there is useful data in the fills, you can enavle its extraction as necessary.
Texts if drawn as real text can provide useful information for cross section takeoff and for elevating lines from 2D to 3D (elevation callouts). If the file contains layers of useful text, enable their extraction.
Linework is typically what you are trying to extract from a PDF file. the lines will represent the existing ground conditions, the finished grade proposal, grading limits, erosion control and other information that is required. Linework as has been said previously will be either solid lines or dashed lines. very thick lines in the plans, is typically drawn using filled polygons, and is typucally of little use to you. Remember also that many other less useul data like leader lines, hatch patterns, polyline text may aslo exist in the PDF file, and those also will be recognized as linework.
Note that in the PDF file all lines are solid. A dashed line is a sequence of solid lines separated with common length spaces between the dashes. Polyline text will be a sequential series of solid lines, separated by variable spacing and in some case a “squiggle” that follows the path of letters. All of the above is “noise”. Dimension Arrows (body and arrow head), leader lines (body and arrowhead) are all lines, and if there are no layer names to work with, the data extraction tools are simply analyzing the dashes, gaps between the dashes, the sequences, the line weights and layer information and color to determine where lines start and stop and what may constitute a line that is useful vs a line that is less useful. The data extraction process is an evolving “science”,and the new tools provide useful controls and a detailed review process that can improve the quality and organization of the extracted data. It is not however perfect, and we are still tuning it more and more to try and further increase the data quality of the information extracted.
Check the boxes beside the data types that you a) want to review and b) want to extract from the PDf file. We recommend that you review one data type at a time ie Lines or Text or Fills. typically Fills and text need less review than the lines, so we would recommend spending more time with the line data than anything else.
Color by Type
If you select this option, the data will be colored using a single shade of Green for Dashed Lines, a single shade of Red for Solid Lines, a single shde of Blue for Text, and Cyan for Fills.
Override Line Weight
When you extract the linework from the PDF, remember that when it sits on top of the image of the PDF page, you will have the extracted linework on top of the Black or Grey lines of the PDF. this can make it hard to see, and depending upon the screen resolution of the monitor you use to run TBC, you should look to increase the luine weight of the data that is extracted. this makes it bolder and easier to see on top of the PDF images. Typically on super high reolution screens, you will want to use a line weight maybe as high as 0.5mm, on lower resolution screens maybe 0.3mm. Find the level that is right for your eyesight and compuer screens that you are using.
Set Line Color
Line colors are typically set to By layer, and the layers that get created are assigned a color (Shades of Red, green, Blue or Cyan (see above). If you are using the revision check work flow described earlier in this document, you can select a color here for the linework to be extracted from the currently selected PDF pages.
Use Layer Prefix
If you are exracting several sets of pages from different page collections (Grading, Existing, Erosion Control, Phasing etc.) then you can elect to prefix the allocated layer names e.g. to add GRDG - to the front of all the layers extracted from each collection of pages.
Data Extraction Preview Process
The data extraction preview process involves the following main steps. If you are trying to move quickly, you can simply click on the Extract Data button below the preview pane to trigger the data extraction process, and bypass the review process altogether. While this is a “quick fix” the time you save here will likely be eaten up and some later on as you start to process all of the exctracted data.
Objective of the Data Extraction Review / Preview Process.
Data Prep from PDF involves the following key process steps. Where you tackle each step is entirely up to the user i.e. you can quickly extract the data and then go through the sorting process to organize and clean up the extracted data, or you can spend some additional time in the extraction process to sort out much of the data to be extracted, reduce the noise that you have to deal with if you extract all of the data in a less controlled manner and get a cleaner starting point for data prep processes that follow.
- Georeference and align / clip the PDF sheets
- Extract data from the PDF sheets
- Organize the extracted data into your preferred layering system
- Remove Duplicate data extracted from the PDF
- Clean the data - ie remove unwanted data, separate all data into usable layers of information, join the data together and break it where necessary.
- Create the data that you really need i.e. areas, lengths, counts or move 2D linework on to 3D linework in readiness for model building and takeoff processs.
- Elevate the data (contours, pads, curb, sidewalk, road cenerlines, ditches, ponds etc.)
- Build the models required for existing and design
- Adjust those surfaces fior stripping, demolition, subgrade adjustent, overexcavation, topsoil respread / lanscaping etc.
- Run your takeoff reports to generate your quantities.
The traitional approach follows the steps above, with the new data extraction process provided here, you can do much of the steps 2 and 3 at the same time. In many cases it will be a hybrid of 2 and 3, ie you take care of some of the heavy lifting in 2 and then do less of 3 to complete the process.
Preview Selected Rows Only Checkbox
You can preview all of the rows in the preview table at once, using just the Lines, Texts and Fills toggle options described above to somewhat limit the data uunder review, or you can check this checkbox, and then review one row of the review table at a time, or you can use the SHIFT and Click to select a range of rows in the review table and review them as a collection. Typically you do your review on individual rows or groups of rows first and then review the overall results at the end.
Update Preview Button
When you select all of the PDF pages for extraction, and then select this option or click the Update preview button, the command will internally extract all of the data from the selected sheets and present a preview of the linework, text and fills to you, fully colored and layered as it will be extracted without further changes in the review table. As you make changes to the review table, the graphics wil update to reflect the latest settings in the review table.
Once the Preview is created, we do not recommend that you click the Update preview Button again unless really necessary, especially after you have undertaken a detailed review of many rows in the preview table, because this button computes and restarts the review process.
Invert preview Button
When you have gone through the review process, you will have checked the Extract checkbox by some of the rows, and unchecked it on others. If you remove the Preview Selected Rows Only Checkbox, you will see a review of all those that have the Extract checkbox enabled. If you wish to review the rows that you unchecked, click the Invert Preview button. This will switch the Extract / Do Not Extract rows so that now the do not extract are being previewed. To return to the original state, click the Invert preview button a second time. Note that this may take some seconds if you have a large number of PDF sheets under review.
Preview Table
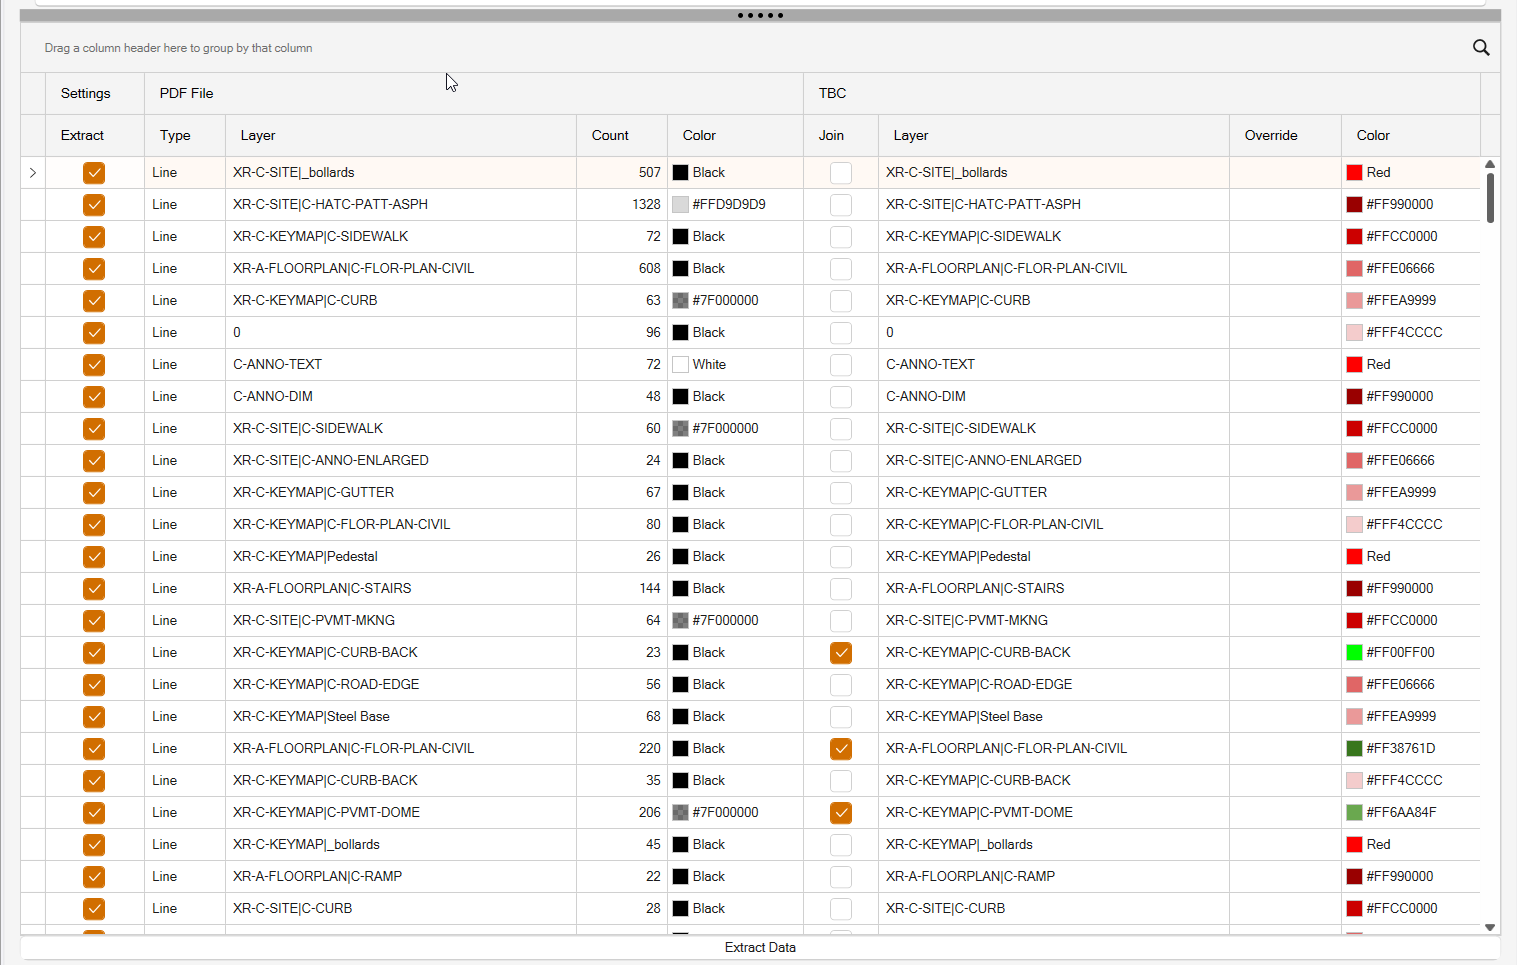
In the preview table you will find many rows of information. You can organize the table in different ways e.g. by selecting the PDF File Layer header and dragging it up into the area that says Drag a column header here to group by that column.
Before Grouping
After Grouping
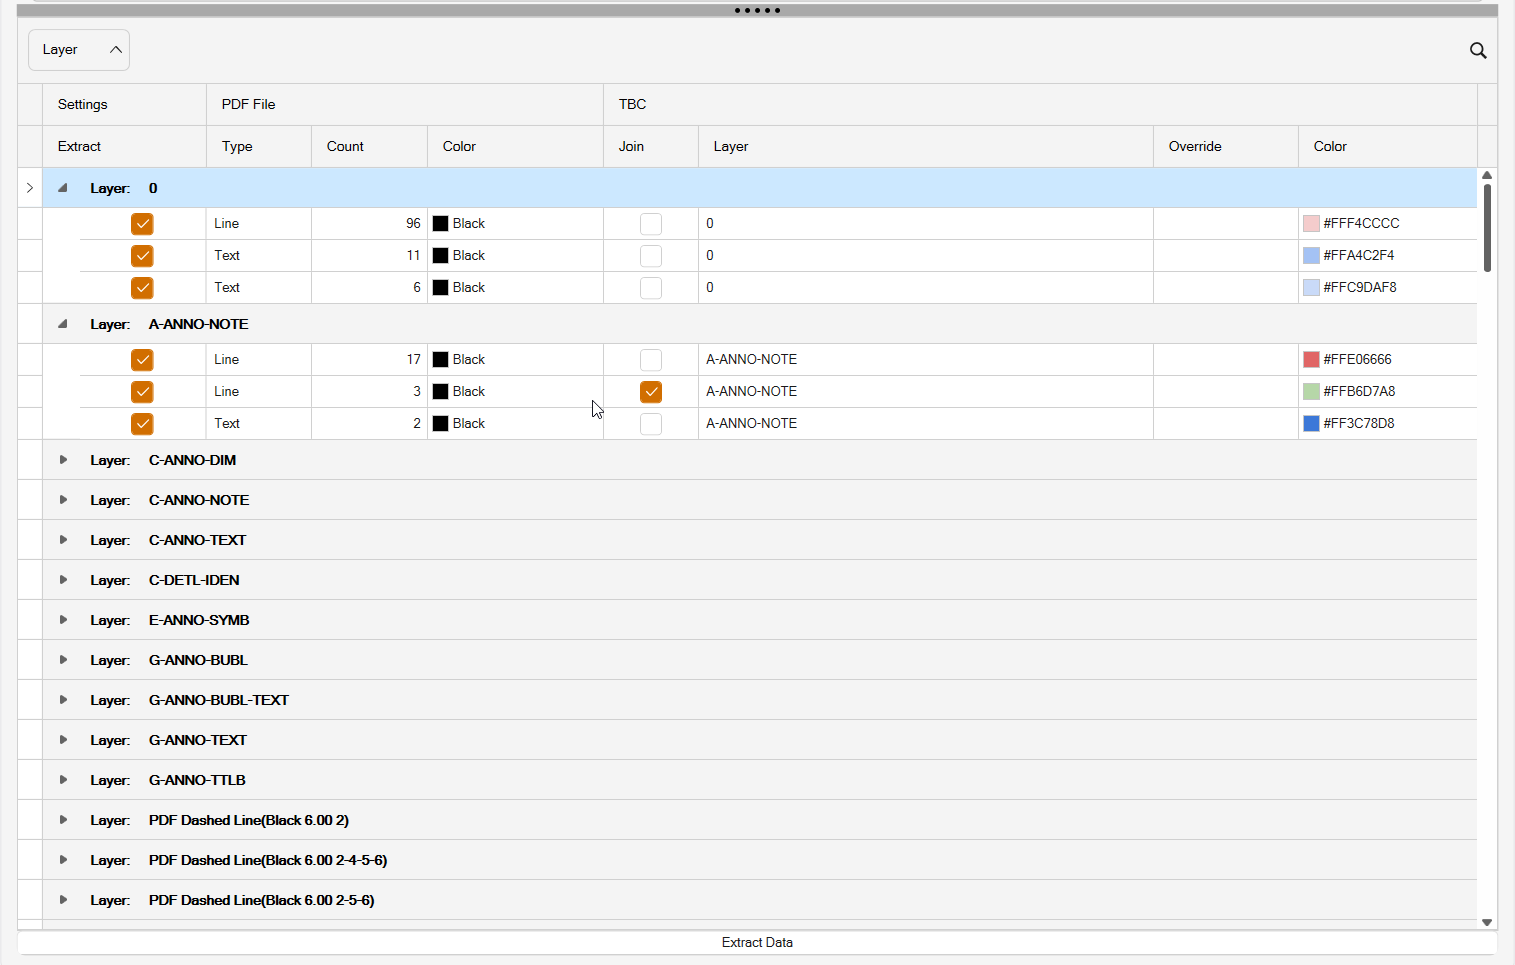
In the latter screen, you will see that multiple rows are grouped under a common layer name. So why are there multiple rows of data for each layer name?
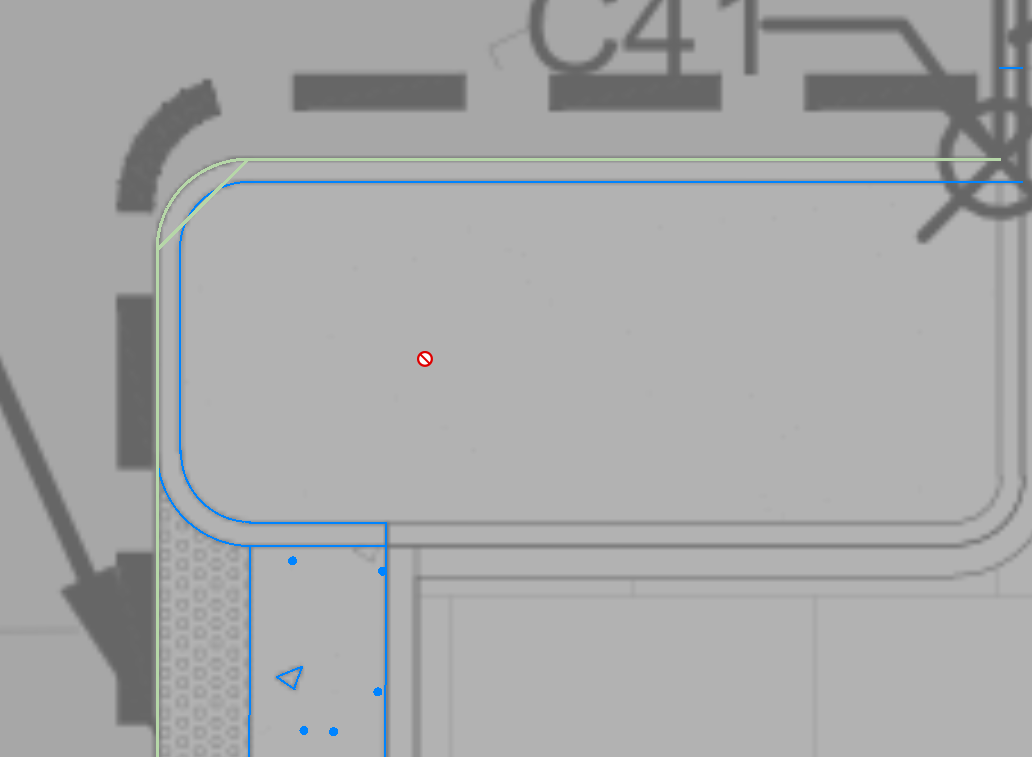
Take this set of lines as an example
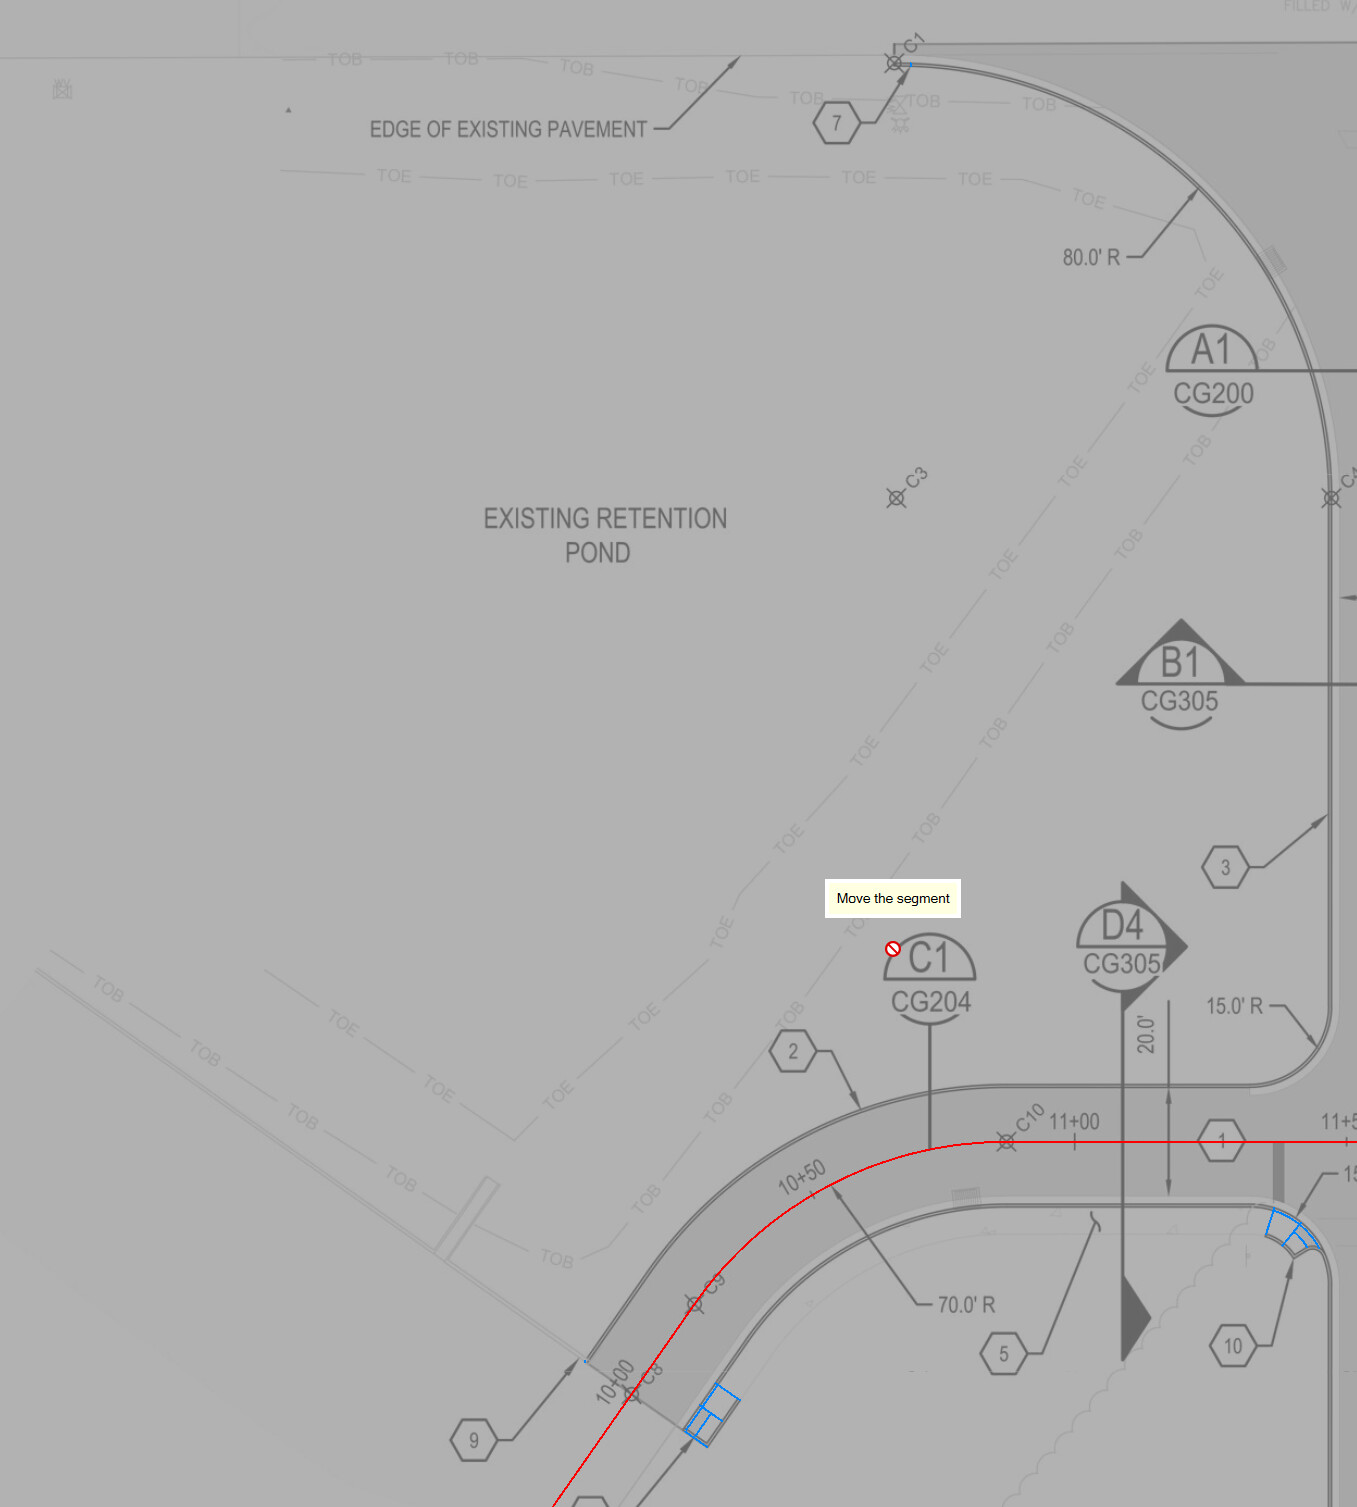
The line that is shown as the TOE or TOB line in the above image, in the CAD file that created the PDF file, was a linestyle that had pen down (dash), pen up (gap) and embedded text (TOE or TOB) in the linestyle. This gets written into the PDF as a set of line segments or multiline segments (the pen down), and a move (the pen up) and as a set of text strings the TOE TOE TOE etc in the file. When the line goes around a bend, the dash patterns get affected, so that the gaps between the dashes or the dash lengths of cmbined adjacent segments differe from the general repeat pattern seen along a single line segment. Because of this some of the lines will be seen as a Dashed line, some segments as Solid Lines and the text as Text objects. As a result you will get three rows of information for lines like these, that you will then have to sort out to some degree afterwards. However all of the objects had the same layer information, the same lineweight and color, so these can be used to piece together large sections of the dashed lines, but some will still need to be addressed after extraction has been carried out.
In this case, the three rows of information will be grouped under the common shared layer name so that they can be reviewed together by group selecting the layers with the preview Selected Rows Only checkbox enabled, or individually as needed y clicking on each row one at a time.
In each row, the row will display the data type in the PDF (Line, text, fill), the Count (please ignore the count currently as we are still working on generating a reliable count of objects in the extracted clipped PDF pages), the PDF Layer (now used as the Group controller), the PDF color (native color ie Black or Gray etc.).
In each row, the row will also display the following TBC behavior on the data
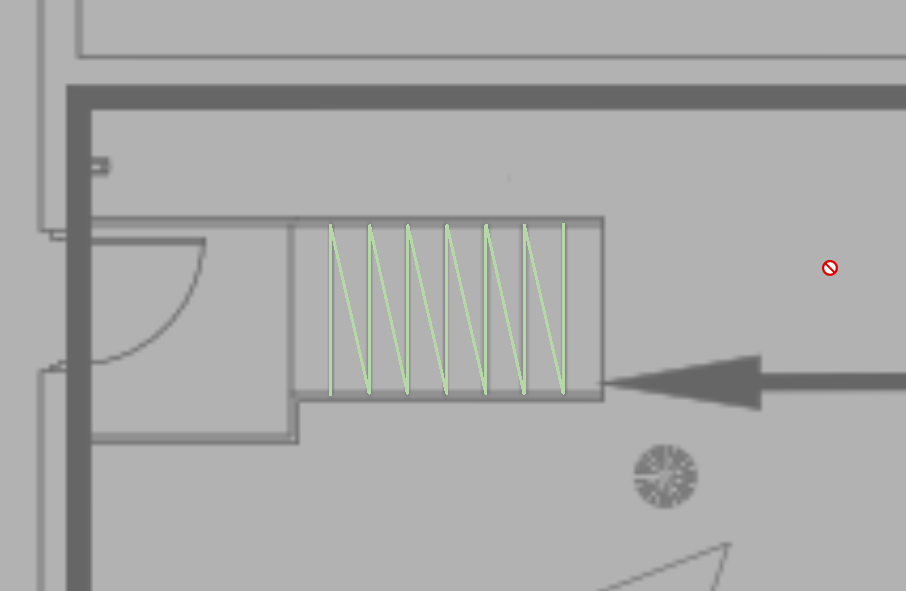
Join - if the line was recognized as a Dashed Line, then it will by default be assigned the Join = On checkbox. In some cases this will give the deired result, in some cases, this will cause lines that should not be joined to be joined togeher - for example take a staircase, the stairs are equal width and are spaced equally in the cad file, and they are drawin in the CAD file sequentially. In the PDF this will be seen as a Pen Down, Pen Up, pen Down sequence, where the pen down length and move length is the same fir each pair of steps. This will be recognized currently as a Dashed Line, when in fact it is a series of solid lines with equal spacing. So in this case, when you see that these lines are joined togeher incorrectly, you can uncheck the Join checkbox to achieve the desired result.
Before State (lines joined incorrectly)
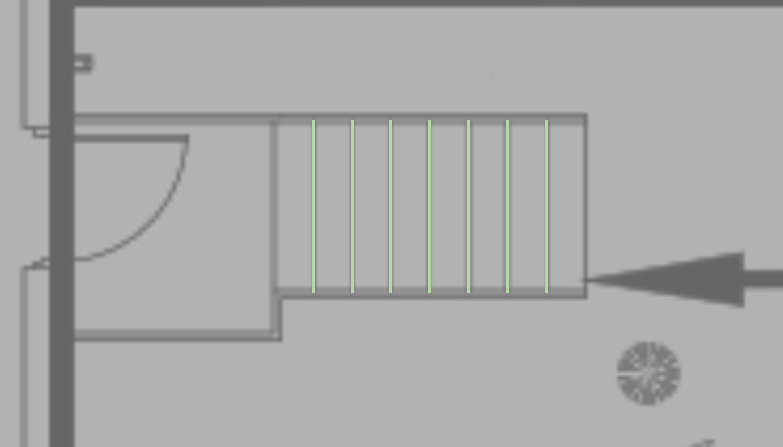
After State (Lines No Longer Joined)
In the same way, sometimes you will find curb and gutter lines like these shown below, which were drawn in the original CAD file as a set of discrete CAD Lines and CAD Arcs that are not joined together, will again be picked up as a dashed line patter that is joined together. The reason for this is that CAD Arcs are always drawn in an anticlockwise direction in PDF files (they are also chorded as well), whereas the lines that are drawn between the arcs may go in the opposite direction. When this happens, the line segment ends, there is a move to the far end of the arc, back along the arc as a en down, then another move to the start of the next line segment and then a pen down along the nect line segment. Because of this the line sequence is seen as a Dashed Line, and the lines get joined together incorrectly abd display like this
Before status
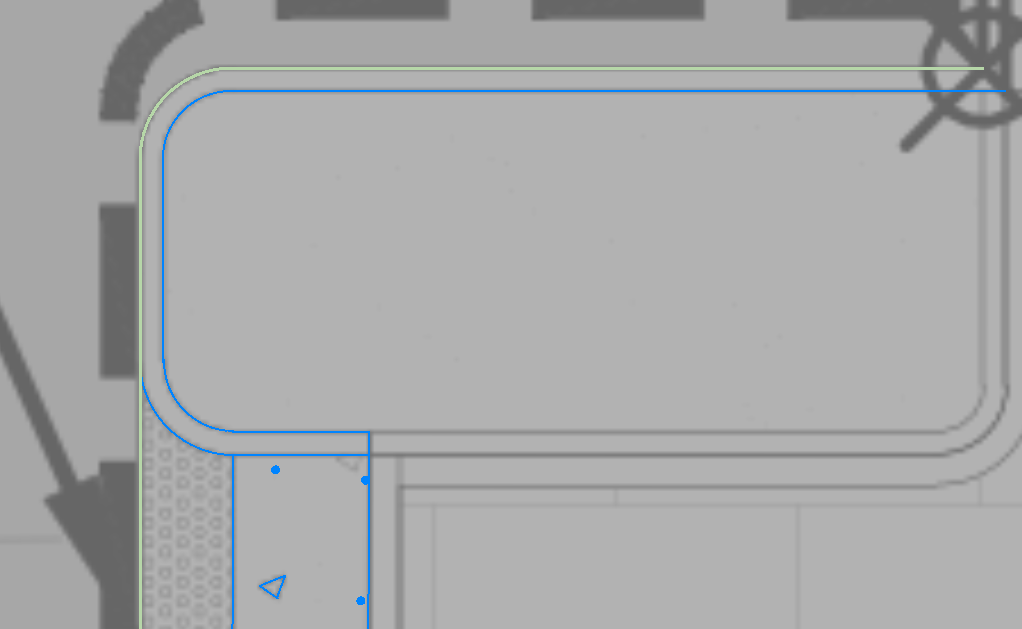
After Status (unjoined)
TBC Layer - The layer name shown here is the layer that will be created to hold the displayed data from the layer after extraction. the layer name will depend on whether the source PDF was a Flat PDF or a Layered PDF, and what setting you are using for USE PDF layers vs Allocate Layers in the main settings for the process.
While reviewing the data, you can add note extensions to a layer name by clicking in the Layer Name field and adding or replacing the text shown. The adjusted name will then be used for the Layer name for the data extracted. This can help you to understand what data can be found on each layer, especially when the layer names are using the PDF Lines or PDF Dashed lines naming convention.
Note that when you are extracting data using Allocate Layers method, the layer naming will be as follows
PDF Line (for Solid lines)
PDF Dashed Line (for Dashed lines)
PDF Text (For Text)
PDF Fill (For Fills)
After the core layer name there will be supplemental detail in brackets which will include
- The line weight
- The Color
- The dash pattern
- The text font
- The text height
For example
PDF Dashed Line(Black 0.00 1-2-3) where 0.00 is the lineweight and 1-2-3 is the repeat pattern of the dashed line.
or
PDF Line(Silver 9.00) where 9.00 is the lineweight
Override
The overrride column will override the TBC Layer Column when enabled. Here you can select a TBC layer onto which you want to place the data associated with this row in the preview table. For example, the row shows the Existing Contour line data, so yiou want to place that on your EX - Contour layer. You can click in the cell and select EX - Contour from the list, you can type in EX - Contour or partially type in the aname and the layer name will be displayed when a match is found. If the layer does not exist, if you type in a name, that layer will be created during the extraction process and will be placed in the Layers Layer Group in the View Filter Manager of TBC.
When you start typing intio the field, the text you enter acts as a filter to aid layer location and selection, it can also be a full data entry field, and it is also a pull down list of layers.
Color
The allocated color will be displayed here, you can change it for any given row using the provided RPS Color Picker.
Additional Preview Table Controls
You can click in the header bar of any column of data and that will trgger that column to control the sorting of the Preview Table e.g. Click in the Type header to sort the rows by data type (Text, Fill, Line), or click in the PDF File Layer column header to sort the rows by the provided Layer or Allocated layer names, Click in the Join column header to sort Joined Lines from Lines that do not have the check box enabled.
Note that when the table is being sorted by one of the column headers as above, if you change the content of that cell in any row, that row will automatically be moved to its correct location in the table.
In the header row for any column, you will also find a Filter control. You can click the Filter control, enter some text characters e.g. CADXS and it will filter the rows down to just those that have those text characters in the name used in that column.
If you check or uncheck the Extract checkbox in any single row, that becomes the active column for the cursor. You can then use the Down Arrow key to move down the table one row at a time, and if you want to Check / uncheck the Extract Checkbox, you just need to press the Space Bar on your keyboard. This can then create a two finger operation, one to move down the rows to preview each successive row, the other to turn on / off the extract function for that row.
If you want to change the position of a column in the table, left click and hold the mouse click while drag and dropping the column header to where you want it in the table.
You can Right Click in the column header of any column or group header if they are nested together and access other table organization features including
Column Headers
- Sort Ascending
- Sort Descending
- Clear Sorting
- Group By This Column
- Hide Group Panel
- Show Column / Band Chooser (To Show / Hide unneeded columns)
- Best Fit - this column
- Best Fit All Columns
- Filter Editor
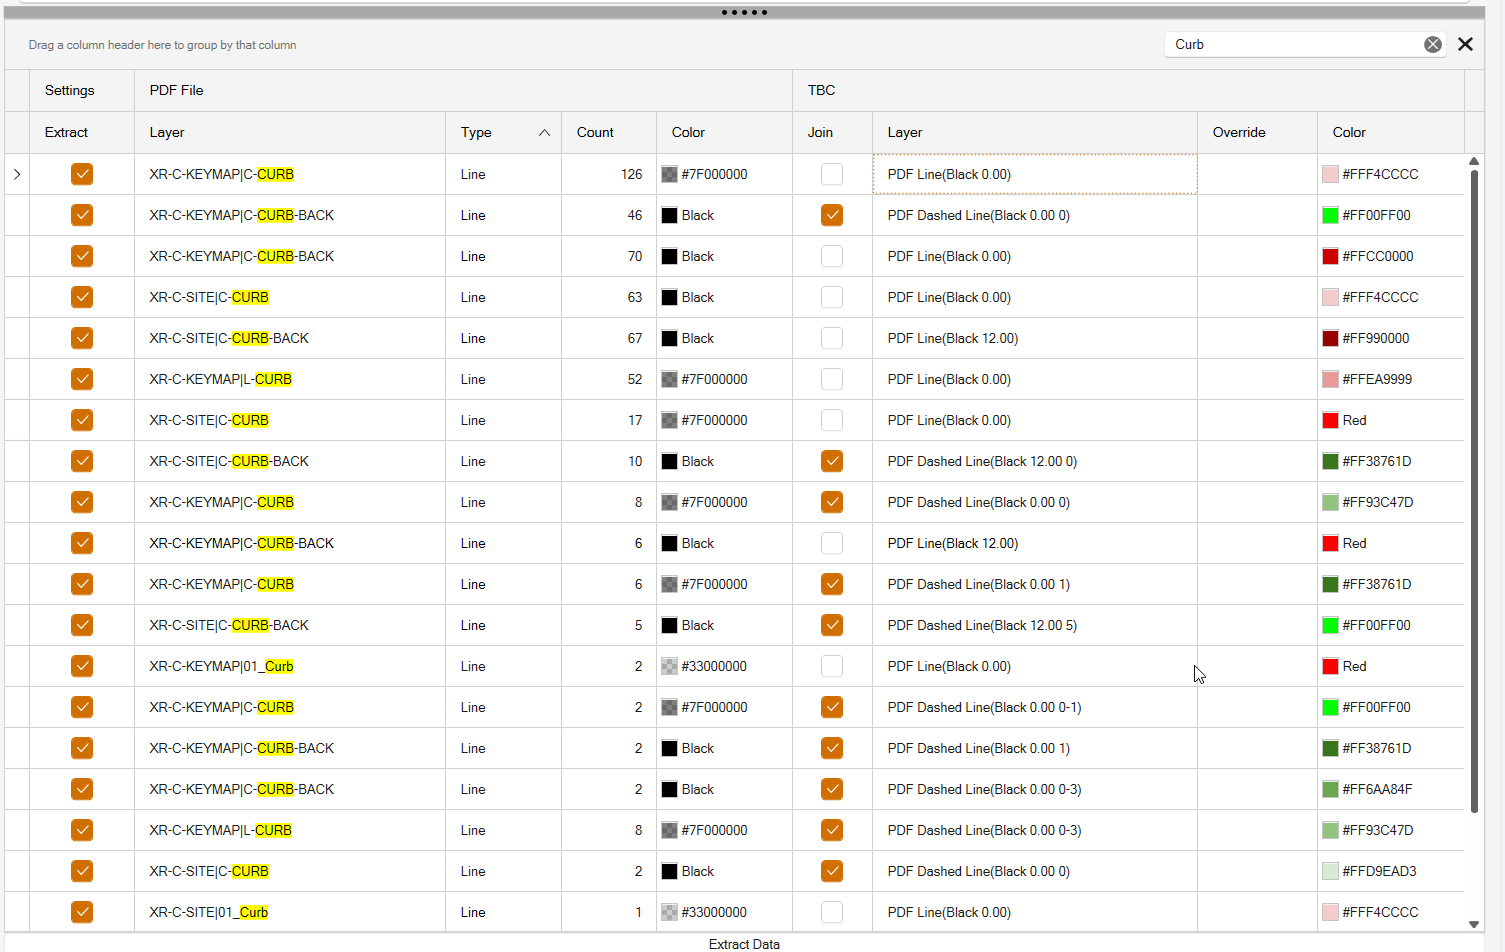
- Show Search Panel (this allows you to search the Preview Table for specific text - e.g. you are looking for Curb layers - Open the Search Panel in the Top Right corner of the Preview Pane, type in Curb and all entries in the table that have that character sequence will be highlighted as shown below. The search acts like a filter also, so only rows that include the word Curb are displayed.
When you have a grouping enabled, right click the Group control item in the header bar to Expand all rows or Collapse all rows if needed
Additional Notes
So this process follows the data, row by row, chenging and overriding settings provided as needed to ceate the best possible data extraction possible. If you find two or more rows that contain data that should go together, you can select the same override layer for those rows, so that on exraction the data is grouped together.
If you are georeferencing multiple sheets together for a project, we recommend that you do all the sheets for a single page collection first and then do a single extraction process for all those sheets combined, so that you only have to do the review process once for all the sheets in a single step. Same applies for e.g. Profile or Cross Section drawings.
Extract Data Button
When you have completed your review, and are ready tomove forwards, click the Extract Data button to execte the process.
End Result
On completion of the extraction, you will find the following Layer Groups in the View Filter Manager
00 - PDF - OTHER DATA - This is the layers that you unchecked the Extract checkbox for. They are still extracted and placed in this group, so that you have the data that they contain in the event that you missed something on those layers that you may need during the review process.
00 - PDF - LINES - Dashed - This contains the layers that carry Dashed Linework
00 - PDF - LINES - Solid - This contains the layers that carry Solid Linework
00 - PDF - TEXT - This contains all of the layers that carry Text
00 - PDF - FILLS - this contains all of the layers that carry Fills
You can now work through the extracted data and reorganize further and go through the joining and brreaking process etc. before moving onto Elevating the data and building 3D models.