Smart Model - Cut Fill Maps
Document Links
Smart Model Command documentation - Click Here
RPS Settings - Smart Model documentation - Click Here
Overview
The Smart Model command provides the ability to create Cut Fill Maps and generate volume / surface information reports that are linked to the cut fill map object that refresh in real time, and that are formatted in a directly presentable format.
The Cut Fill Map functionality also includes the ability to apply either pre defined or user defined color maps to the cut fill model, and define how the surfaces will be displayed in Plan and 3D views. The color map options include normal cut fil maps, rock cut maps (designed specifically to provide Rock Cut details), and tolerance maps ideal for tolerance checking on As-Built surfaces.
The Cut Fill Map incorporates an interactive volume and surface information report that dynamically updates as settings changes are made e.g. applying Shrink / Swell or Loose Haul Bulking factors, changing the Cut Fill Map color scheme or updating either surface model that causes the Cut Fill numbers to change.
Command History
July 2025
First release of Cut Fill Map capability.
Video Demonstration
The following video shows how to utilize the Smart Model - Cut Fill Map command.
Command Interface Description
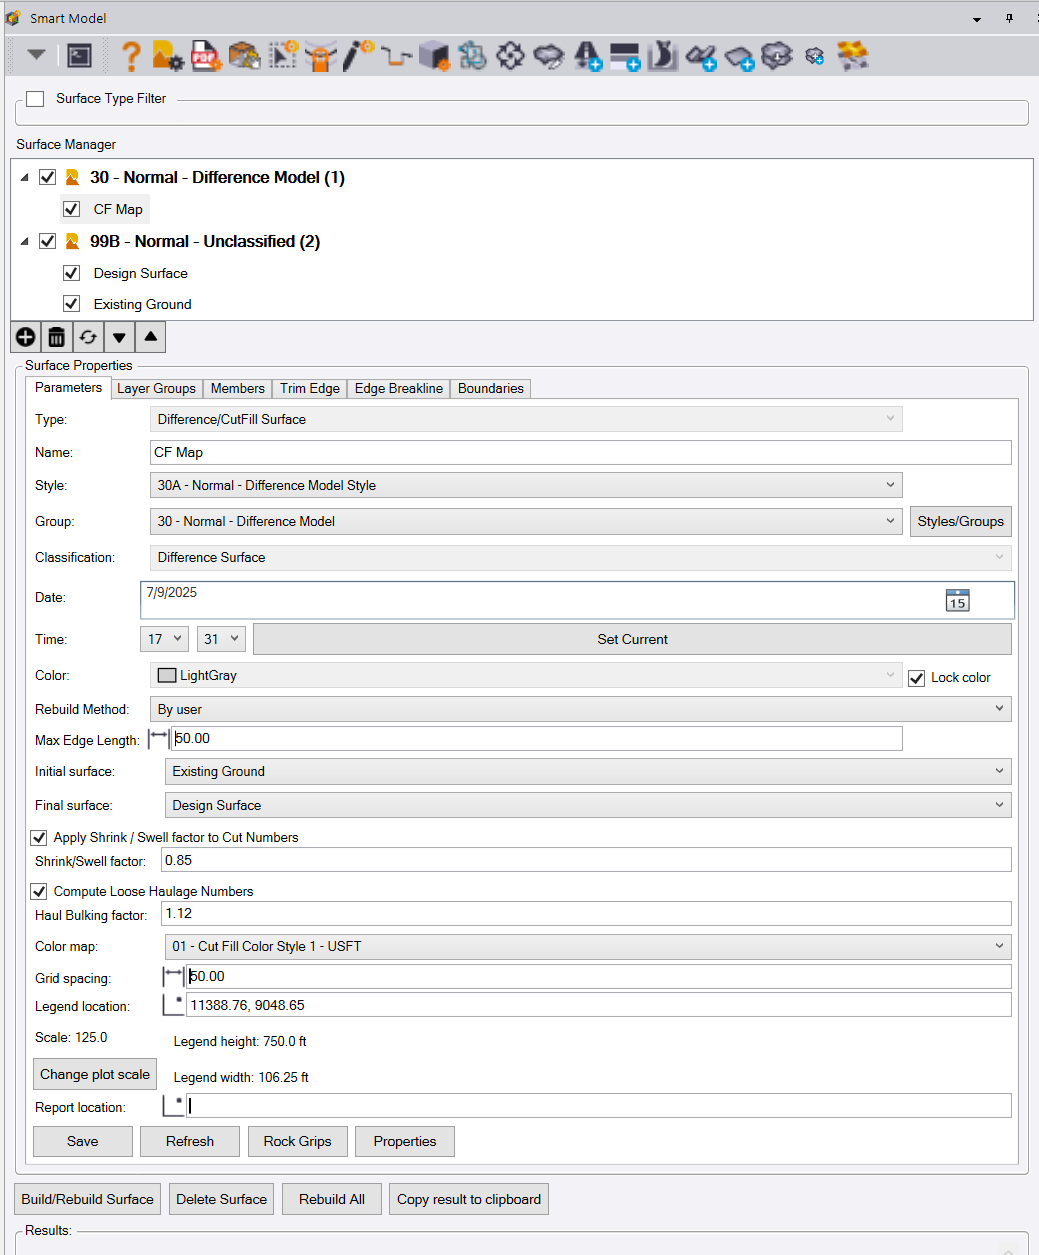
The Smart Model - Cut Fill Map function dialog looks as follows
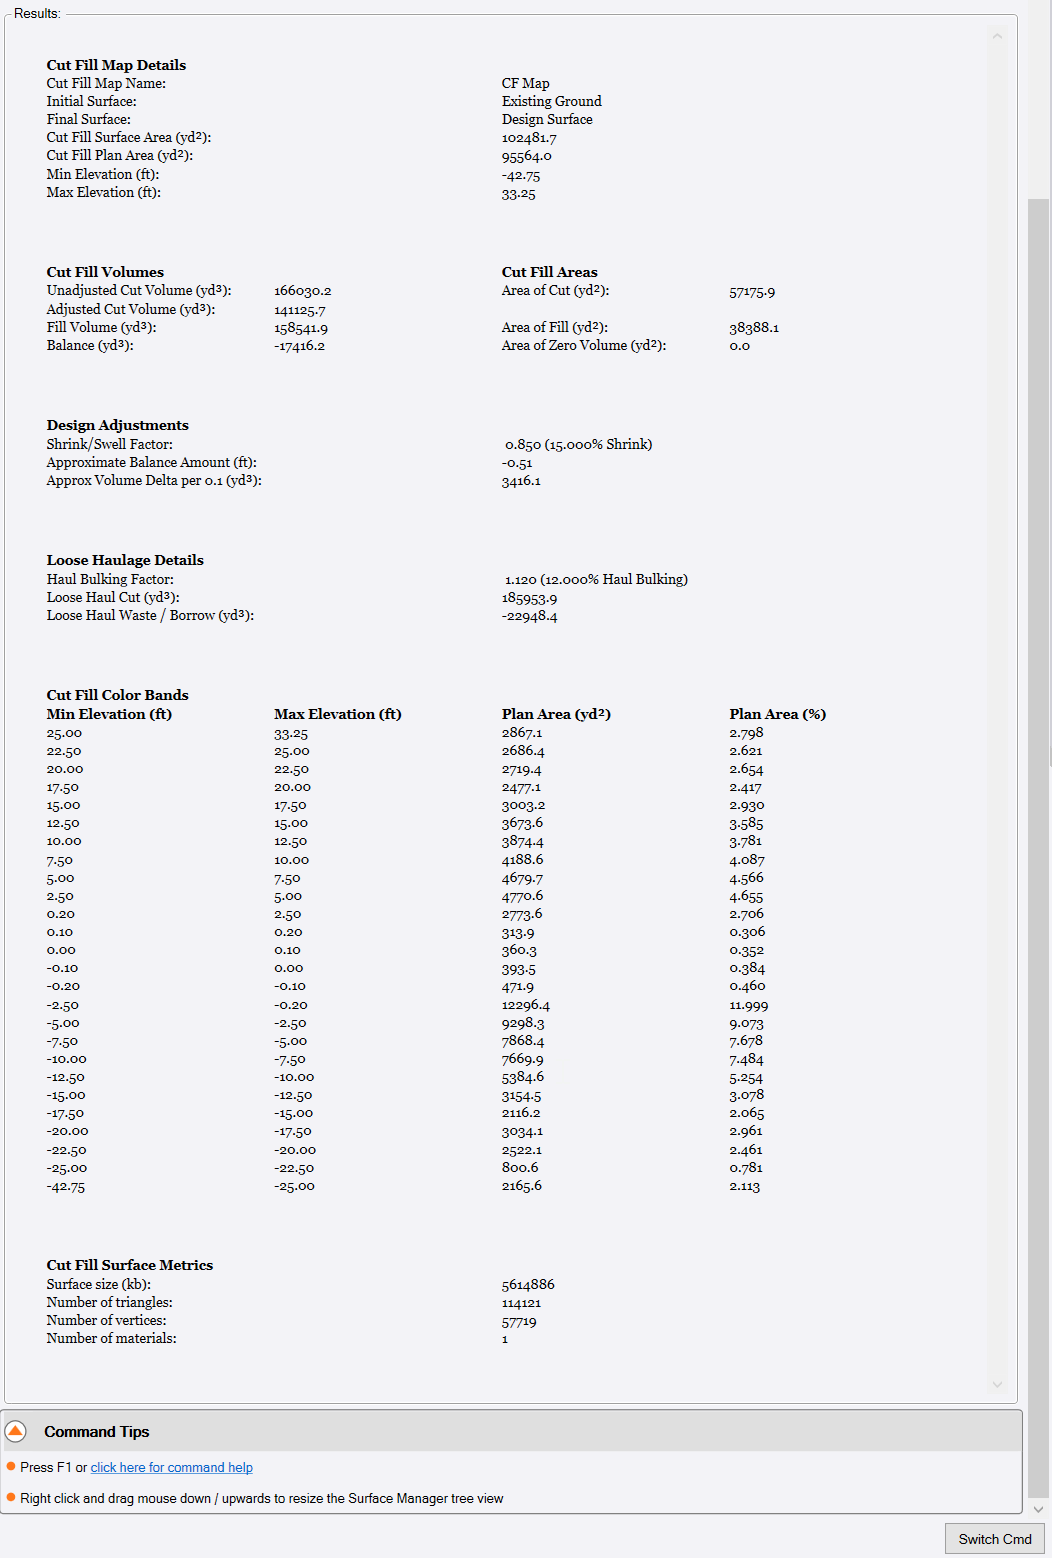
When a Cut Fill Map has been created, the results pane populates a full report for the cut fill map and all associated volume calculations as shown below. This results pane is dynamically linked to the settings controls above as well as to the surfaces used to compute the Cut Fill map. If any element changes, the results pane reflects the current state as soon as the Save button is pressed. If the cut fill map needs to be recomputed, that can happen automatically if the rebuild method is set to Auto or triggered by the user if set to By User.
For details on the Surface Type Filter and Surface Manager window please refer to the Smart Model command documentation.
Command operation
To create a Cut Fill / Difference Cut Fill Surface model, click the ![]() button below the Surface Manager window. This will open the dialog shown above.
button below the Surface Manager window. This will open the dialog shown above.
Type:
To create a cut fill map, select type Difference Cut Fill Surface from the list of options.
Name:
Enter the name for the Cut Fill Map. A default name Cut Fill Map is presented, you can accept that name or overtype the name to provide something more descriptive if you plan to have more than one cut fill map in your project.
Style:
Select the style that you want to use to control the display of the cut fill map in the Plan and 3D views, style definitions are described in the Smart Model command documentation, the specific settings to use that relate to cut fill map generation are covered later in this document. The pre defined style named 30A - Normal - Difference Model Style is a good start point for this process. Select that from the list of options.
Group:
The cut fill maps will be placed into a group within the Surface Manager tree window. The default group is 30 - Normal - Difference Model, however if you prefer to group your surfaces e.g. by specific areas of the project e.g. Bridge 1, Bridge 2 etc. then you may also decide to keep the cut fill maps for those areas also in the same group, so you can override and select a different group from the list. Surface Groups are described in detail in the Smart Model command document. Groups put surfaces together into logical groups for easier / faster visibility management and to aid the user when managing large numbers of surfaces on projects.
Classification:
All surfaces have a classification option in TBC which is used to aid volume calculations, to help ensure that cut is truly cut and fill is truly fill. Cut Fill maps are classified as Difference Surfaces automatically. The classification for cut fill maps cannot be changed.
Date and Time
Set the date and time either by clicking the Set Current button which takes the current date and time from your computer clock / calendar, or set the date and time that you feel is relevant for the computation that you are about to do - this could be the date that the second model was surveyed, or the pre construction start date, or the date that the As-Built survey was carried out etc. The date can be selected from a calendar or simply typed in, the time can be selected from the pull downs for hour and minute fields.
Rebuild Method:
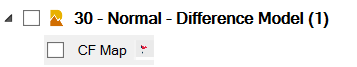
Select the rebuild method that you want to apply to the surface. Remember that Cut Fill Maps are dynamically linked to the two source surfaces, and if set to Auto will rebuild every time you make a change to either of the two source surfaces, or the object data that is associated with those surfaces. It is probably better to select By User so that you update the cut fill map when you are ready to do so, after all changes have been made to the source surfaces. You can easily select the cut fill map and click the rebuild button (described below), when you have made all of your edits to the source surfaces. If you are not using the cut fill map for the time being, you can also set the rebuild method to Show Empty, this holds all of the parameters for the cut fill map, but removes the result cut fill map object from the database and graphics, until you change the rebuild method back to Auto or By User. If set to By User, if either of the source surfaces change, the Cut Fill Map will be flagged in the Project Explorer pane (Surfaces / Cut Fill map section), as well as with a red flag next to the cut fill map in the Surface Manager Tree
Max Edge Length:
Set the maximum length of a triangle side that will be used to constrain the cut fill map isopach surface created by the command. Do not make this number too small so that it creates gaps in the Cut fill map, or too large so that long triangles are created around the edges of the cut fill map isopach (difference model) surface.
Initial Surface:
Select the first of two surfaces that will be used to create the Cut Fill map. Typically select the surface that is the “earliest surface” of the two surfaces being selected, i.e. Existing Ground, or Original ground with Topsoil and Subgrades Demolished etc.
Final Surface:
Select the second of two surfaces that will be used to create the Cut Fill map. typically select the surface that is the “latest surface” of the two surfaces being selected, i.e. Finished Design or Finished Design with Subgrades Adjusted and Topsoil Removed etc.
Apply Shrink / Swell factor to Cut Numbers checkbox:
Check this checkbox if you want to apply a shrink or swell factor e.g. 0.85 (15% Shrinkage) to the cut numbers generated, to adjust the volumes to allow for compacted placed fill being a smaller volume than the native in ground material pre cut (bank qty).
Shrink / Swell factor:
Enter the Shrink or Swell factor here.
A factor like 0.85 will shrink the computed Cut number by 15% for when it is placed as compacted fill e.g. if you are excavating soils like Clay, Sand, Gravel, Soil, these typically get smaller as they are placed and compacted in fill because you are eliminating water and airspace content in that process.
A factor like 1.15 will bloat the computed Cut number by 15% for when it is placed as compacted fill e.g. if you are drilling and blasting rock, it can get larger when it is fragmented because it now has more air / void space than it had before being blasted.
Compute Loose Haulage Numbers checkbox:
Check this checkbox if you want to compute and report the loose haulage volumes of the Cut and the Waste or Borrow materials in addition to the Cut / Fill numbers. The Loose Haulage Volume of Cut is the volume of Cut x the Haul Bulking Factor for the material i.e. if you excavate soil and place it in trucks, the material is larger in the loose haul state than it is in the native bank state. When you compute the Cut Fill numbers and determine that there is either an excess or deficit of materials on site, you either have to haul in material to satisfy the deficit, or haul material to a waste location to eliminate the excess material on site. The Loose Haul number will give you a more accurate estimate of the total haulage volumes to move the Cut to fill or to import or waste material to or from site.
Haul Bulking Factor
Enter the Haul Bulking Factor here
The haul bulking factor is normally a number greater than 1 e.g. 1.12 would be a 12% increase in material volume when it is in the loose haul state.
Color map:
Select the color map that you want to apply to the Cut Fill map. A number of pre defined color maps are available to you from the pull down. Three types of color map are possible
Cut Fill Map
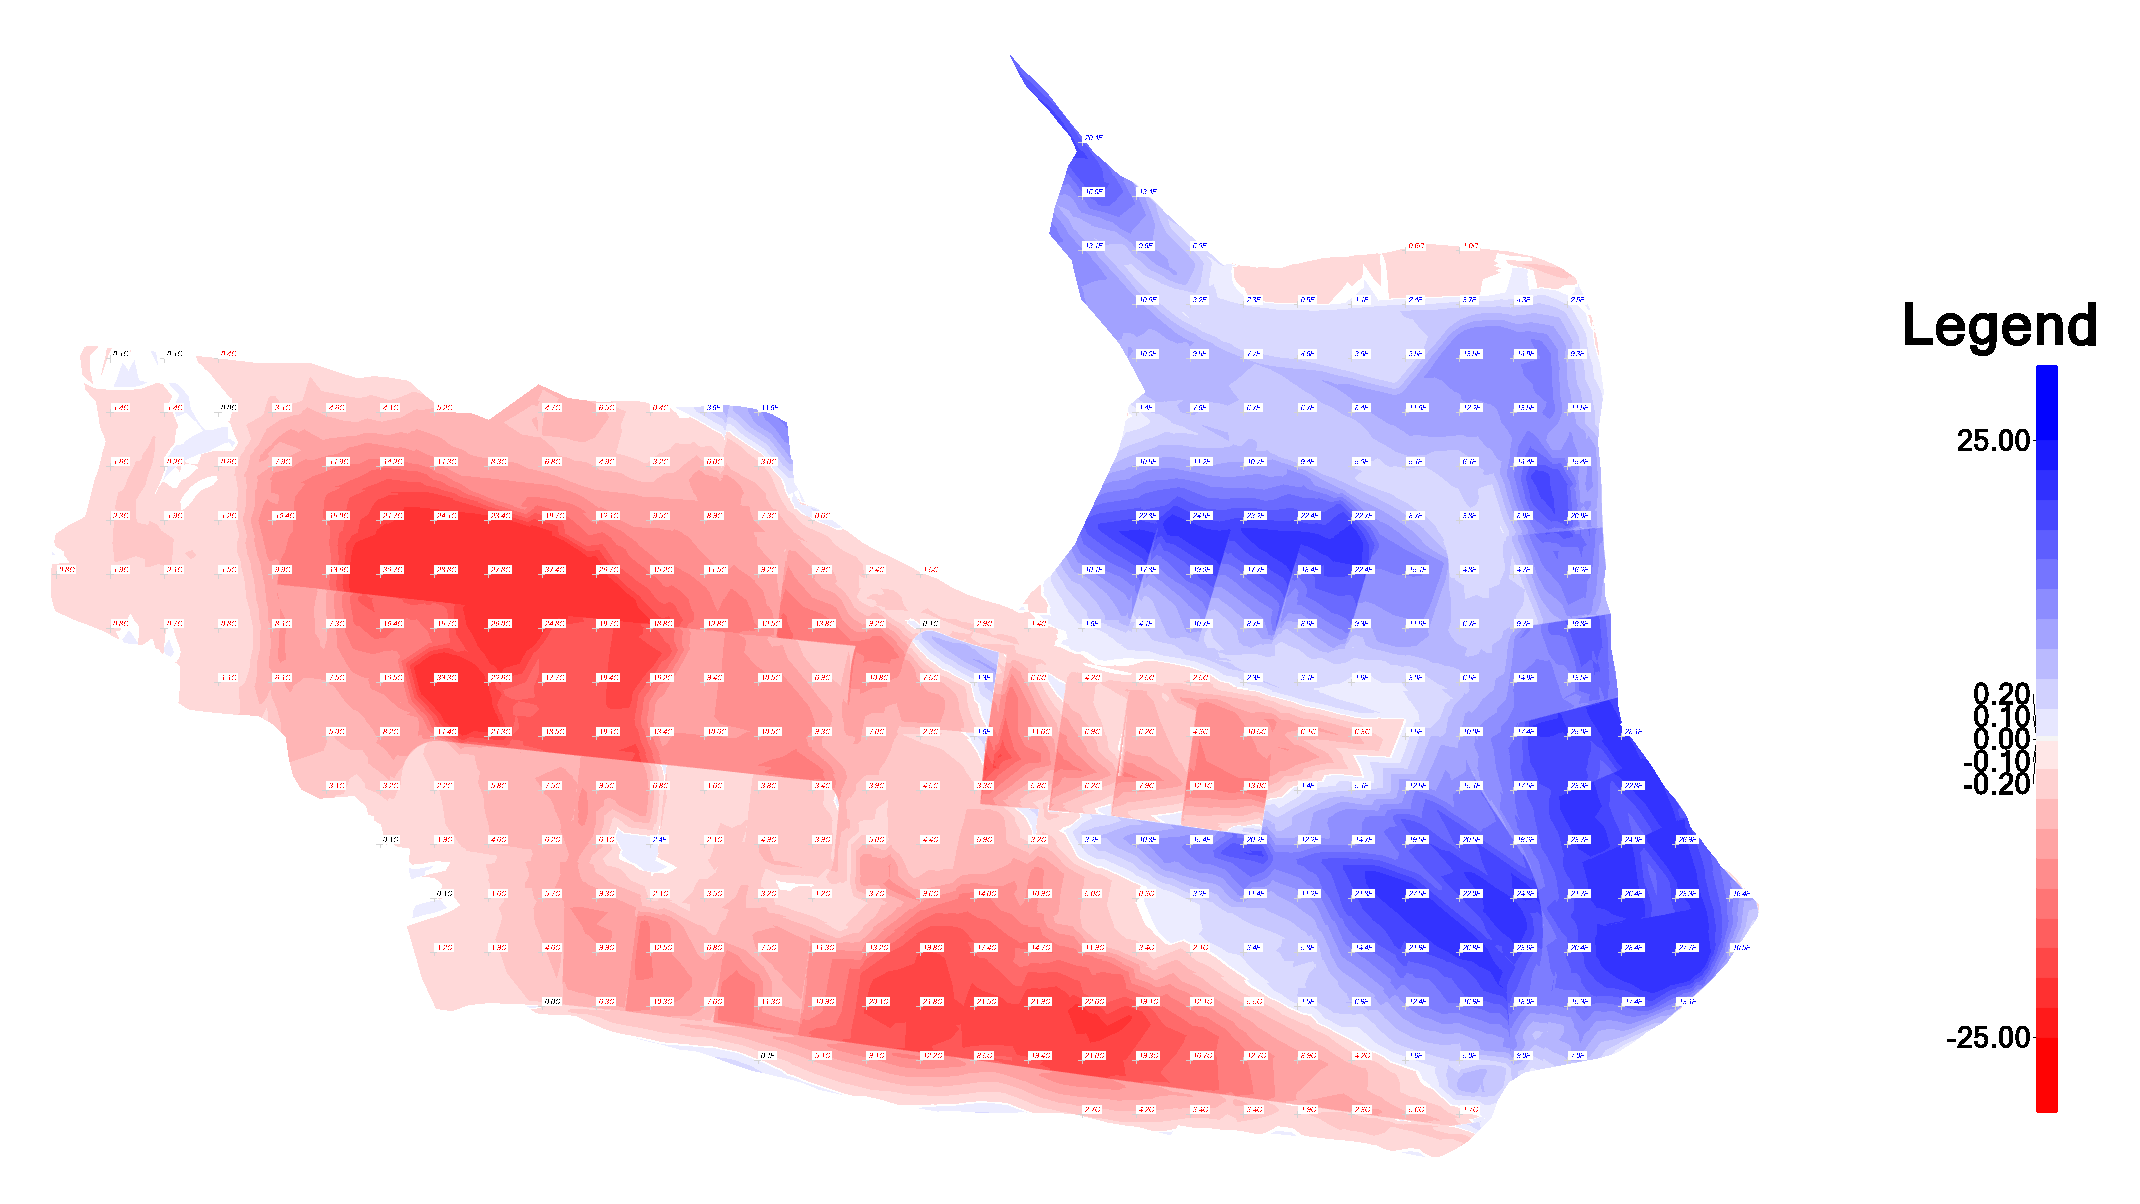
This colors the design surface with the Cut and Fill depth schema, where by default Red = Cut, Blue = Fill and White = On Grade. The Cut Fill Map Style allows you to define many color bands to apply shades of red or Blue or any other colors to different depth of cut or fill brackets. The color banding will either Auto Compute the band intervals based on pre defined depth sequences, or will allow you to define your own specific band depth values.
Tolerance Map
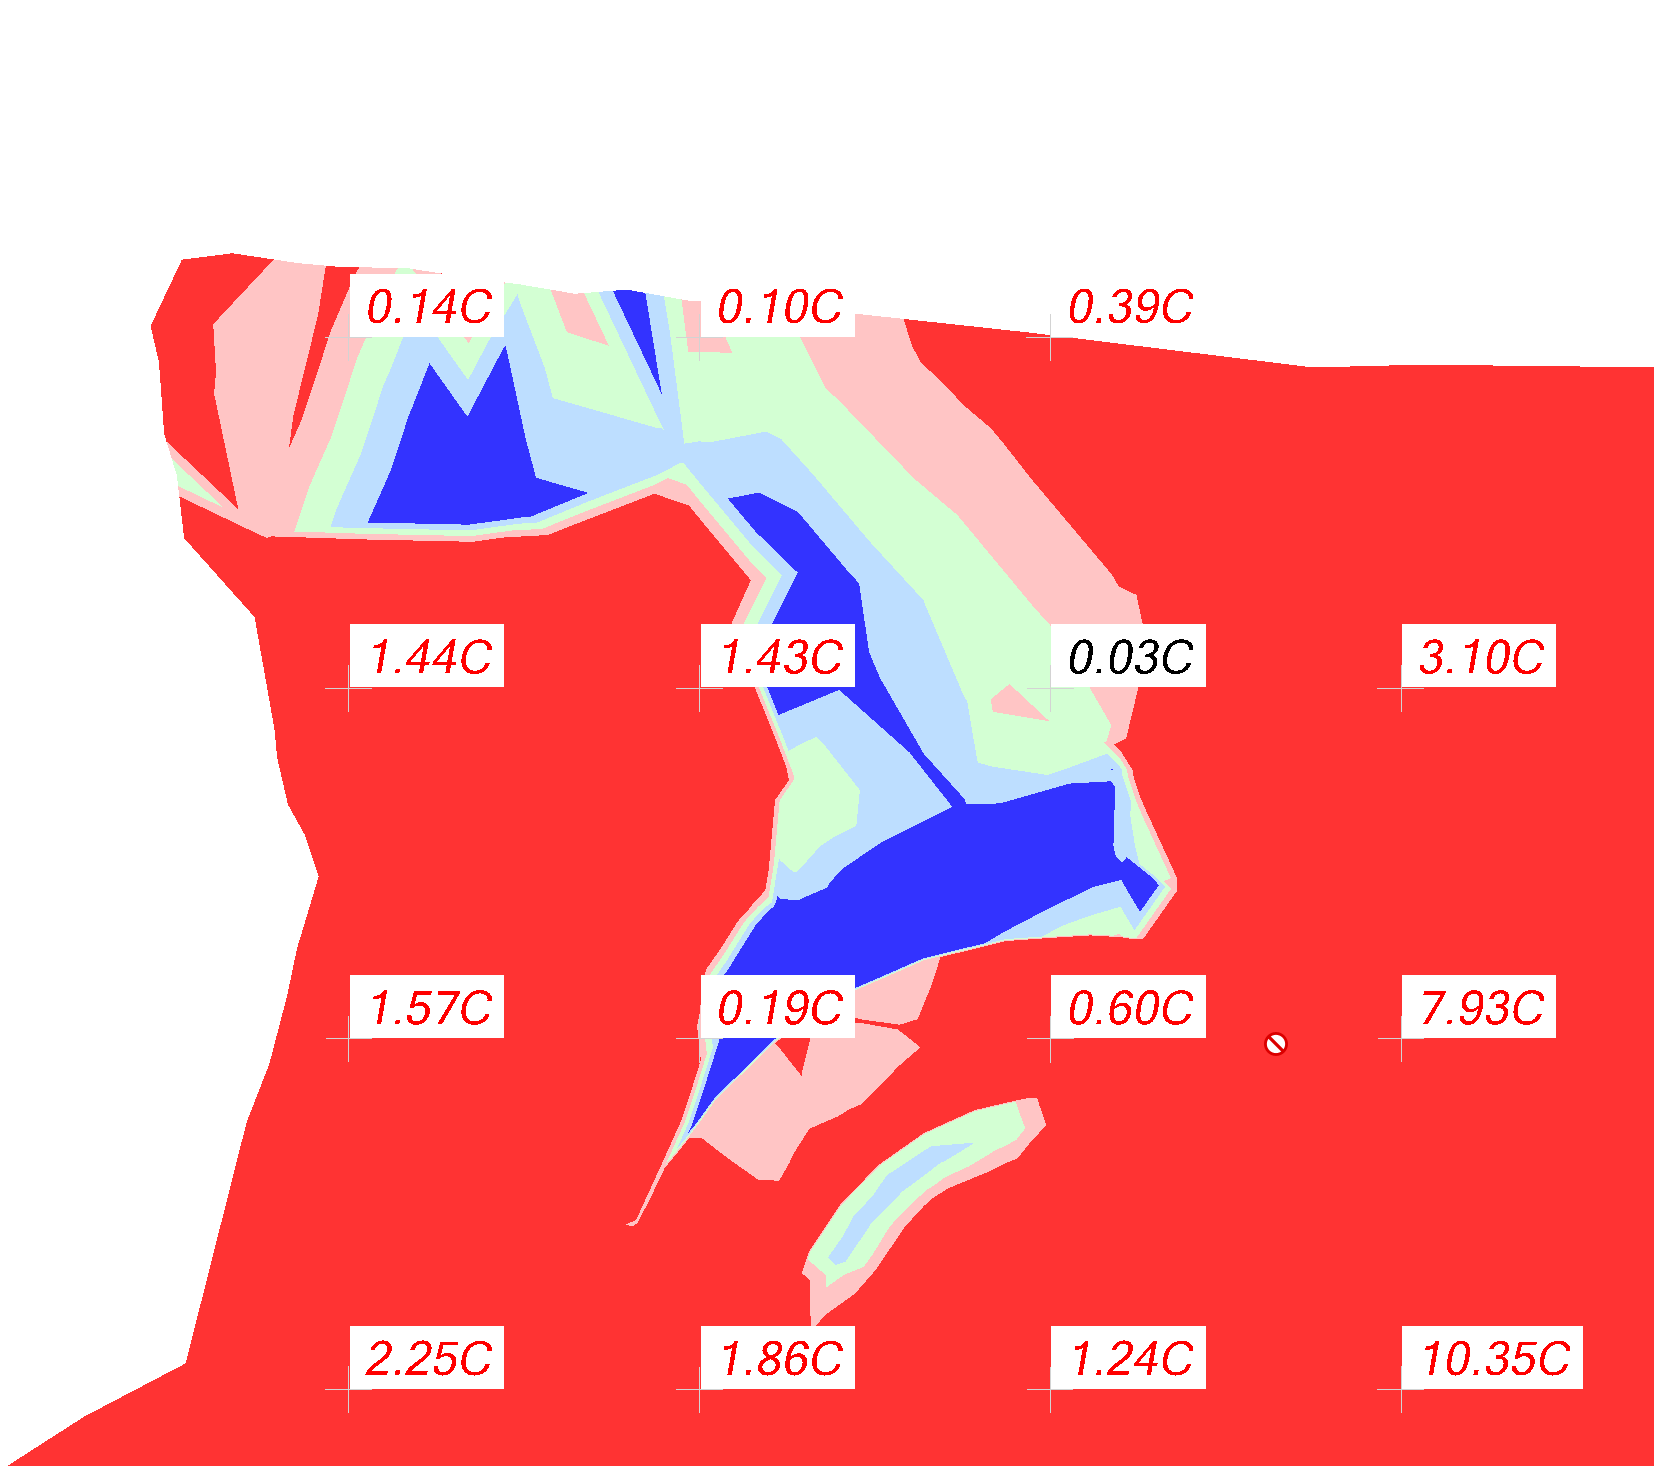
This colors the surface based on In Tolerance, Near Tolerance or Out of Tolerance color bands both High and Low in relation to the design / target surface model.
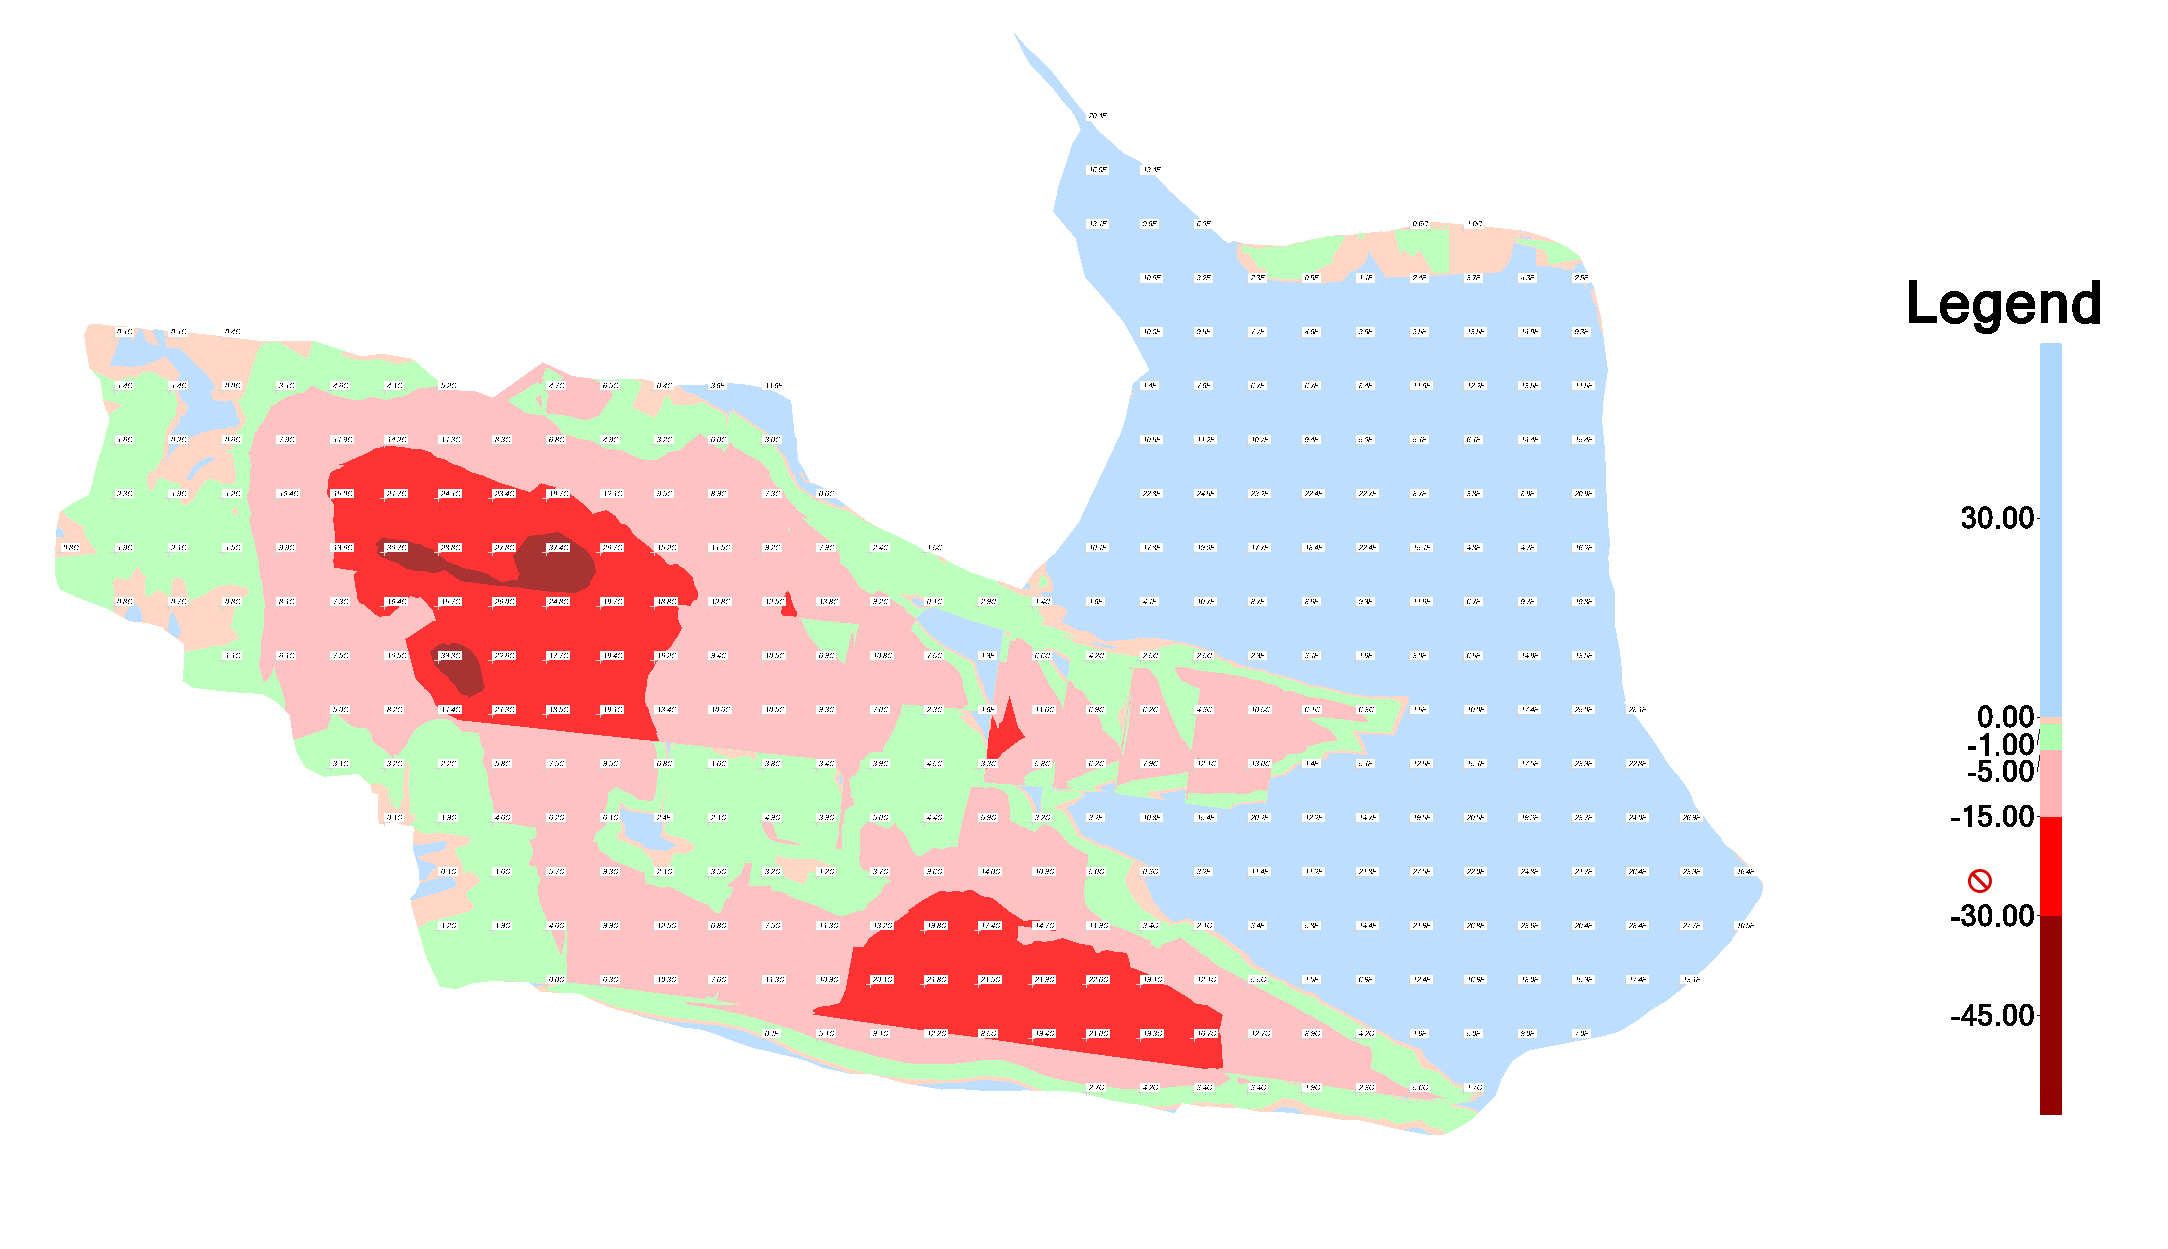
Rock Cut Map
This colors the map based on different depths of Rock Cut for a project e.g.
0-1’ of Rock Cut can be chipped off with an Excavator with a rock hammer attachment.
1-5’ of Rock Cut is expensive Rock Cut, you cannot drill less than 5’ depth, so if you only have 3’ of rock then you have to still drill 5’, excavate 5’ and then replace 2’ of fill to achieve design.
5-15’ of Rock Cut is typically a single drill stem drill and blast process, you can drill exactly to design and only excavate exactly what is required for the project.
15-30’ of Rock Cut is typically two drill stems or two drill and blast benches, so carries a different cost than a single drill and blast process.
In this type of color map, the depth bracket surface areas are also reported so you know how much of the rock excavation falls in each of the different depth brackets, that can be used for cost estimating breakdown.
There are examples of manual banding, auto banding and all three of the color map styles in the default installation of Smart Model. You can update or modify or create your own cut fill map color map styles to meet your requirements.
Grid Spacing:
The Grid Spacing is the distance between the Cut Fill Map labels that are placed over the Cut Fill Map e.g. 50’ grid is common.
Legend Location
The cut fill map legend provides a color bar with elevation labels that shows the correlation between color of the cut fill map and the different depth brackets. Darker colors represent deeper cuts and deeper fills typically.
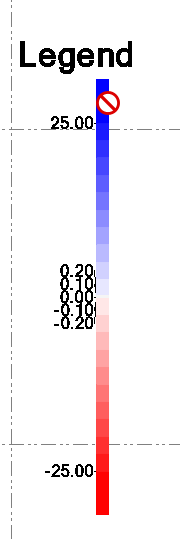
Note: The Legend Title, Legend Values and legend Height and Width are dependent on your selected Plot Scale that controls the height of text defined using text Styles defined using Sheet Units vs Ground Units. The default values in the provided styles are a good starting point, you can either adjust the plot scale using the Change plot scale button, or change the legend definition in RPS Settings. The current Plot Scale is shown as a reference, and can be changed here rather than changing it in Project Settings. The legend height and Width are defined in settings using inch units, the plot scale multiplies the inches by the defined plot scale to determine the width and height for the legend in ground units. Those values are displayed here so you can see what the legend will look like in relation to the project area. To change the displayed legend, change the plot scale, or change the RPS Settings for the legend and then click Save - this will update the legend automatically. The legend will also update if you change the cut fill color map being used, or if either surface changes causing the depths of cut / fill to change. You can also click a location or update the location for the legend if you want to move it graphically.
Report location:
The Cut Fill Map report can be placed automatically on the drawing area at a defined location. Note that we have had some issues with this feature, and it is in fact easier to use Windows Snipping Tool, Sharex or Snagit type screen grabbers to capture the elements of the report required to the clipboard, and then use RPS Paste to place the report on your Plan or Sheet View drawing areas. You can do the same for the Cut Fill Map itself also.
Save:
When you have defined the settings and made your selections, press Save to create or update the cut fill map object, legend and results pane.
Refresh:
Click the Refresh button to refresh the graphics, surface manager tree etc. and the parameters of the Cut Fill Map if you made changes to the settings e.g. via the properties pane or some other means.
Rock Grips:
the Rock Grips provide the ability to enable the graphical object grips while the RPS commands are still running (not possible with normal TBC commands). This allows you to reposition or resize legends, reports, images etc. using grip edits while Smart Model is running. Click the Rock Grips button and then click on the object you want to move or resize, and then use the grip handles to action the required changes.
Properties:
To update the Properties pane with changes made in Smart Model, or to display the properties of the selected Cut Fill Map in the properties pane, click the properties button.
Build / Rebuild Surface button:
Click this button to trigger a manual rebuild of the selected surface or cut fill map.
Delete Surface button:
Click this button to delete the selected surface or cut fill map.
Rebuild All button:
Click this button to trigger a manual rebuild of all surfaces that have been flagged as needing a rebuild, because a component object or parameter has been changed requiring a rebuild.
Copy result to clipboard button:
Click this button to copy the contents of the Results Pane to the clipboard.
You can also select the contents of the results pane and use CTRL C to copy it to the clipboard and then Paste the selected text into Excel or Word or a text Editor etc. You can also copy it into a Text item in TBC, however TBC Text doesn’t support the rich formatting of the results pane data.
You can also use the Windows Snipping tool, or Sharex type software to capture an image of the results pane that you are interested in, and then use RPS Paste to paste it onto the Plan or Sheet View of your choice.
RPS Settings for Cut Fill Maps:
The Cut Fill Maps function of Smart Model utilizes the RPS Settings for the Surface Groups and Surface Styles. In addition the Cut Fill Map utilizes RPS Settings for the Cut Fill Map specific settings, legend settings and color map creation process. You will find the Cut Fill Map settings at the base of the Smart Model Settings tab of RPS Settings. When creating the legend, the Title Text and Content Label text styles are defined in the RPS Settings - Table Settings tab.
The Cut Fill Map Settings area of the dialog looks as follows, the Surface Groups and Surface Style settings are covered in the main Smart Model help document - click here if you would like to rad through that in the context of the Cut Fill map process.
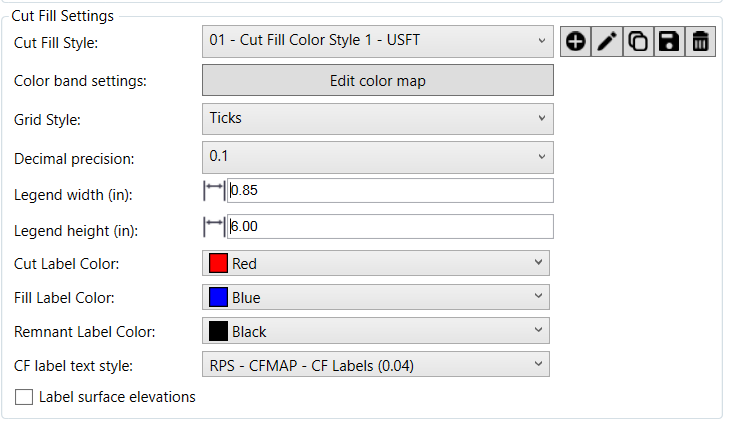
Cut Fill Style
There are a number of predefined Cut Fill color map styles delivered with the Smart Model command. You can select one here from the available list. You can also create a new color map and define it with the color band settings (see below). You can copy an existing color map, edit the name of a color map, save a color map and delete a color map.
There are three main types of color map settings
Cut Fill Color Map
For cut fill map creation. In this mode the color map shows different ranges of cut depth and fill depth, so you can clearly see where your largest cut and fill areas on the project are.
Rock Cut Color Map
Specifically for coloring rock cut volumes measured between a rock surface and a design model. This calls out different depths of rock cut i.e. from 0-1’, from 1’ to 5’, from 5-15’, from 15-30’ etc.. These bands correlate to different methods / cost brackets of rock excavation. the 0-1’ bracket is for rock removal using a rock hammer on an excavator. The 0-5’ band is for the minimum depth of drill and blast operations, even if you only have 2’ of rock cut to design, you have to drill and blast a minimum of 5’, excavate the material and then backfill to design, so the work is more costly. The 5-15’ is for single drill stem drill and blast. In this bracket, you can drill to design depth and only excavate what you have to excavate, and you can typically drill in this bracket with a single bench / single drill stem length. above 15’ of rock cut, you typically have exceeded the single stem drill length and also single bench excavation, so the cost of excavation is higher as a result.
Tolerance Color Map
These are used to check As Built surfaces against design surfaces, they allow you to set up in tolerance band(s), near tolerance band(s) and out of tolerance band(s) on both the high and low side. The color map then shows you where you have completed work in tolerance, and where you have so far failed to meet the tolerance for the surface, and by how much you have missed the tolerances for construction.
Color band settings
Click the Edit color map button to open the color map editor.
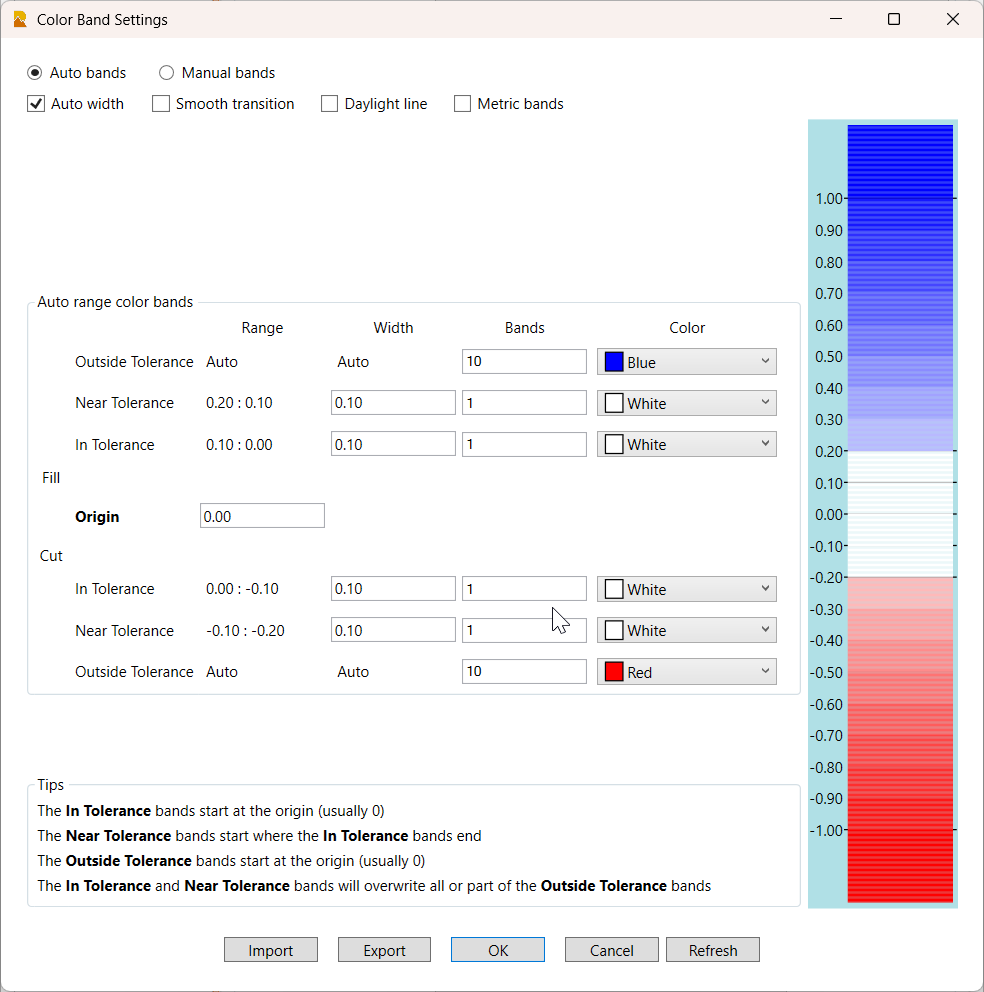
There are two main types of color map definition.
Auto bands
These compute the elevation range of the cut fill map and set the elevations of each band using a set of standard intervals defined by the software. The banding used is a round down to the nearest reasonable banding interval. the banding intervals include a sequence as follows. 0.01, 0.02, 0.025, 0.05, 0.1, 0.2, 0.25, 0.5, 1, 2, 2.5, 5, 10, 20, 25, 50, 100 etc.
If the range of the cut fill map is between -12 and +17, the range is 2x17=34 in order to equalize the color range for cuts and fills. 34 is compared to the range intervals and the closest match is 25. So the color bands will max out at +/- 12.5, the deepest Cuts or Fills will then all be at the darkest colors of the spectrum.
The color map shown above, which is 01 - Cut Fill Color Style 1 - USFT is a good example of an Auto Bands color map.
- Manual Bands
The manual color bands are defined by the user. The color bands are entered from the lowest upwards. you can define a specific color for each color band defined. here is an example of a manual bands color map.
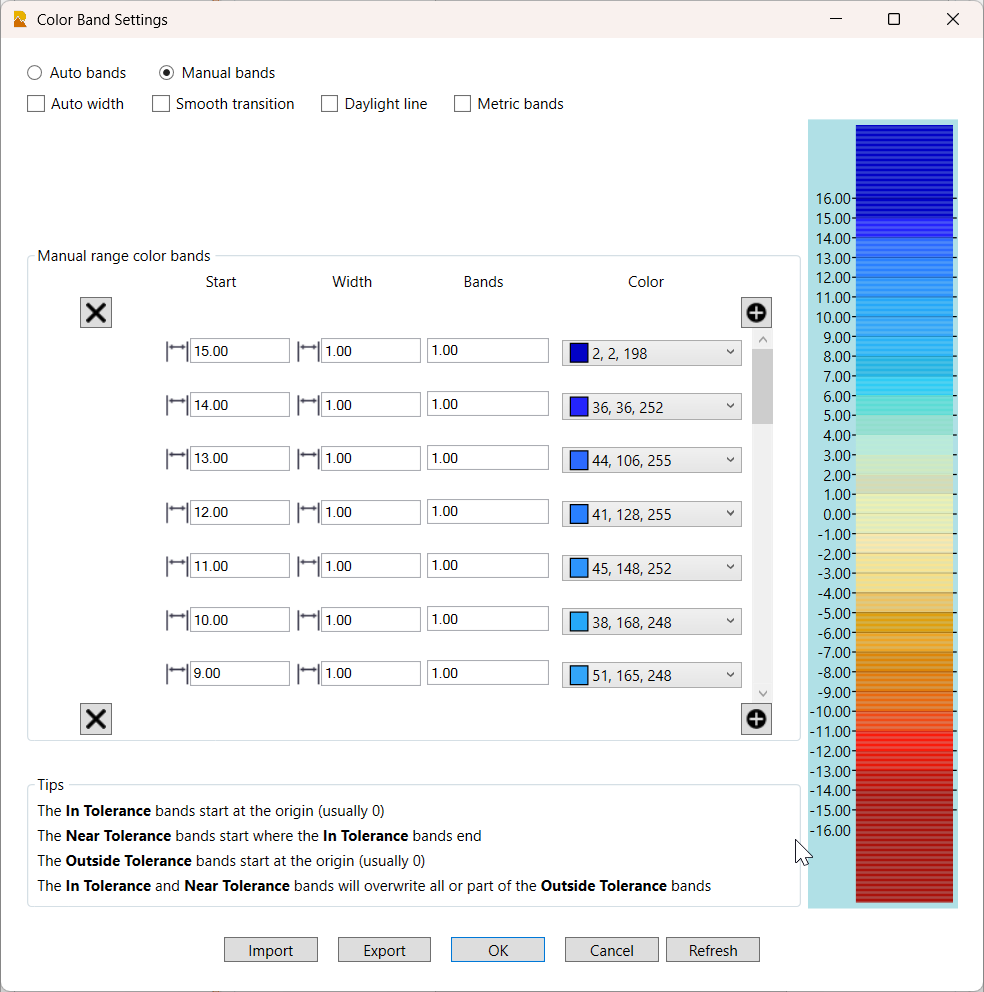
Start at the lowest band and work upwards, so for example
Start at -15, set the band width to 1 and a single band of this color and then set the color for the band. This band will then run from -15 to -14.
If you decide to set multiple bands for a selected color, then the color map will create you that number of bands of the same interval, and will split the color from the selected color into lighter shades for the additional bands defined.
Click the refresh button to update the color map and elevation labels to see the curet state of the color map, it is not updated in real time as you make edits.
Select a color band and hit one of the X keys to delete the selected band.
Click one of the ![]() buttons to add a layer at either the top or bottom of the list.
buttons to add a layer at either the top or bottom of the list.
Color Map options
The following checkboxes control the following functions of the color map
Auto width checkbox
Typically used with the Auto bands option, and is always applied to the outside tolerance bands. this triggers the auto scaling and auto computation of the elevations for each band of the color map.
Smooth transition checkbox
This is an alternative to hard edge banded color maps. the smooth transition blends the bands together so that the colors smoothly transition from one color to the next. the default hard color bands, clearly differentiate each of the color bands so that you can readily correlate a color to a cut fill band.
Daylight line checkbox
Check this checkbox if you want the cut fill map to have a clearly defined daylight (zero elevation) line that follows the line of zero volume / surface elevation difference.
Metric bands
The command has a set of installed color maps for both USFT and Metric. They are differentiated by this checkbox. Metric band color maps will show up when the project template selected is a metric template. USFT color maps will show up when the project template selected is a USFT template.
Import
You can import TBC .tcf color map files if you were using those for your color maps in prior versions of TBC before Smart Model. Once imported they will be added to your RPS Settings file for the Smart Model command.
Export
You can create a color map in Smart Model and then export it as a .tcf file for use in the TBC Cut Fill Map commands. You can also share your settings file with other RPS users if you want to create a set of standards that is used by all team members. The RPS Settings file is called RPSSmartModelSettings.rps - this contains all of the RPS standard color maps and settings. If you create your own Surface Groups, Surface Styles or Color Map styles, those will be stored in RPSSmartModelCustomSettings.rps. The default settings file may be overwritten with new or updated versions of the file with future updates of the command. your own personal settings file (the custom one) will not be affected by future updates of the command.
OK
Click OK to save your changes and return to the main RPS Settings command.
Cancel
Click Cancel to close the dialog without saving your changes.
Refresh
Click the Refresh button to refresh the color legend to show the current state of the color map definition.
Origin
In most cases the origin of a color map will be 0. However if for any reason that is not the case, you can set a value that will be used as the origin value, the color map color bands will then be centered around the non zero origin.
In Tolerance, Near Tolerance, Outside Tolerance bands
The terminology used here is multifunctional. The color bands are defined as above zero e.g. shades of Blue (Fill / Out of tolerance High / above existing / initial surface), and below zero e.g. shades of red (Cut / Out of tolerance Low / below existing / initial surface). When you are doing Tolerance Maps for As Built or Quality checks, the the In, Near and Out of Tolerance has more specific meaning. In tolerance means that the surface is in tolerance at this location, Near Tolerance can be used in two ways - I am nearing the tolerance band but still in tolerance or I have gone outside the tolerance band but I am still close to tolerance. The out of tolerance band is exactly what it says it is, you can define multiple bands of out of tolerance to give a better indication of how far out of tolerance you are at that location.
Typically Green would be used for In tolerance, Orange for near Tolerance and Red / Blue for out of tolerance in a tolerance color map.
Examples of Cut Fill Maps
Traditional Red Blue Cut Fill Color Map
Rock Cut Color Map
Tolerance Color Map
Grid style
Select your preferred label grid style - the options are
- Ticks - this places a cross at each cut fill label location
- Lines - this creates 3D lines across the surface to create a regular grid that can be visualized
- None - this suppresses the creation of the cut fill labels on a cut fill map.
Decimal precision
Select the precision required for the cut fill labels e.g. 0.1’ or 0.01m. This is used for the cut fill labels and the surface elevation labels (see below) when enabled.
Legend width
This is the width of the cut fill map legend in inches. Typically 0.85" is a reasonable choice.
Legend height
This is the height of the cut fill map legend in inches. Typically 6" is a good choice for drawings that will be placed on an 11x17 sheet.
Cut Label Color
Select the color that you want to use for Cut Labels e.g. Red or Black
Fill Label Color
Select the color that you want to use for Fill Labels e.g. Blue or Black
Remnant Label Color
Select the color that you want to use for Labels along the daylight line (no cut or fill) e.g. Green or Black
CF label text style
Select the text style that you want to use for the cut fill map labels. RPS - CFMAP - CF Labels (0.04) is typically a good choice if you are using the RPS project template. Text styles can be defined or edited using the RPS Text Style Manager.
Label surface elevations checkbox:
Check this checkbox if you want to label the initial and Final surface elevations as well as the cut fill map elevations in the label grid for the cut fill map.
Command Tips
This area of the dialog provides access to the help documentation for the command, it also provides any important tips, shortcuts or other useful information that you may need while running the command.
Header Bar Commands
The header bar of the command dialog contains icons that provide quick access to other related commands that you may want to use while executing this command. If a command is already running in the command stack, the header bar icon also acts as a smart switch to toggle the active command to being the command related to the icon.
Header Bar commands always include the core RPS Tools
- Help
- RPS Settings
- PDF Manager
- CAD Cleanup
- Smart Select
- Smart Draw
- Smart Edit
- Smart Elevate
- Volumes Manager
In addition the following commands are also available
- Shrink Wrap
- Track region Outline
- Surface Slicer View
- Create Corridor Surface
- Create Subgrade Surface
- Overexcavation
- Create trench Surface
- Create planar Surface
- Merge Surfaces
- Create Composite Surface
- Combine Surfaces
Switch cmd
The Switch cmd button provides a list of running RPS commands, as well as the ability to close the current command or close all running commands. You can select one of the running commands to execute a different set of tasks. If you press the ESC key on your keyboard, that pulls up the list of running commands right beside your cursor in its current location. Pressing the ESC key twice will close the current command and switch to the next running command in the command stack.
Use Case Videos
The following videos show the use of the Smart Model - Cut Fill Map command in a work process context
Feedback and Enhancement Requests
If you would like to provide feedback on the use of the Smart Model - Cut Fill Map command or to request enhancements or improvements to the command please click Reply below.