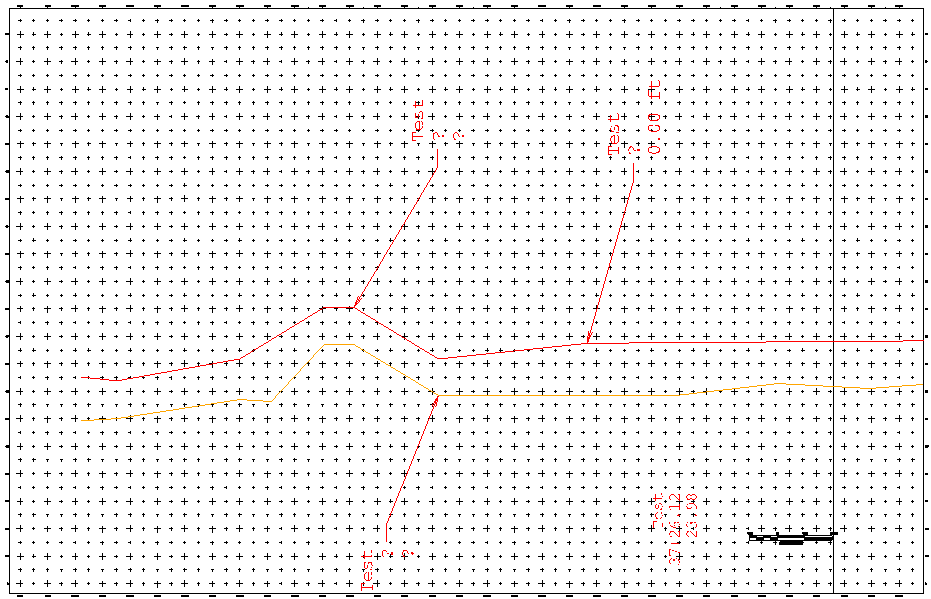
Working with a profile view of an alignment and corridor. I am currently struggling to get the points labeled with their station and elevations at each point of both separate lines. The current viewport looks like this with what I have set up. The blue text does not show up in sheet view but is the target information.
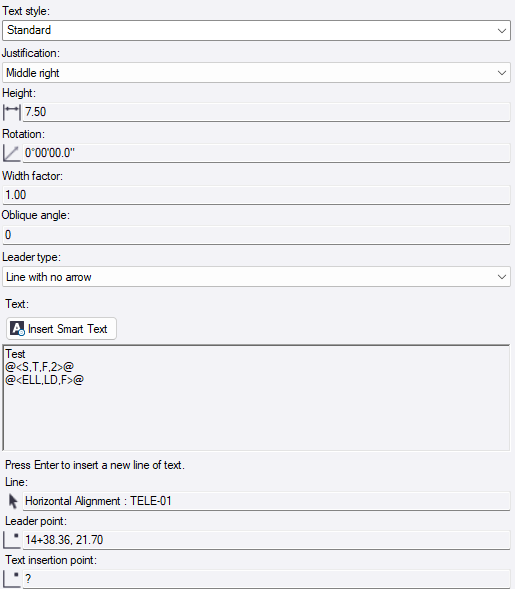
What I am hoping to figure out is how to get the station, elevation and slopes of both the red and orange line shown in the sheet view. Currently I have tried using drafting text to label them based on horizontal alignment with the code below:
Test
@<S,T,F,2>@
@<ELL,LD,F>@
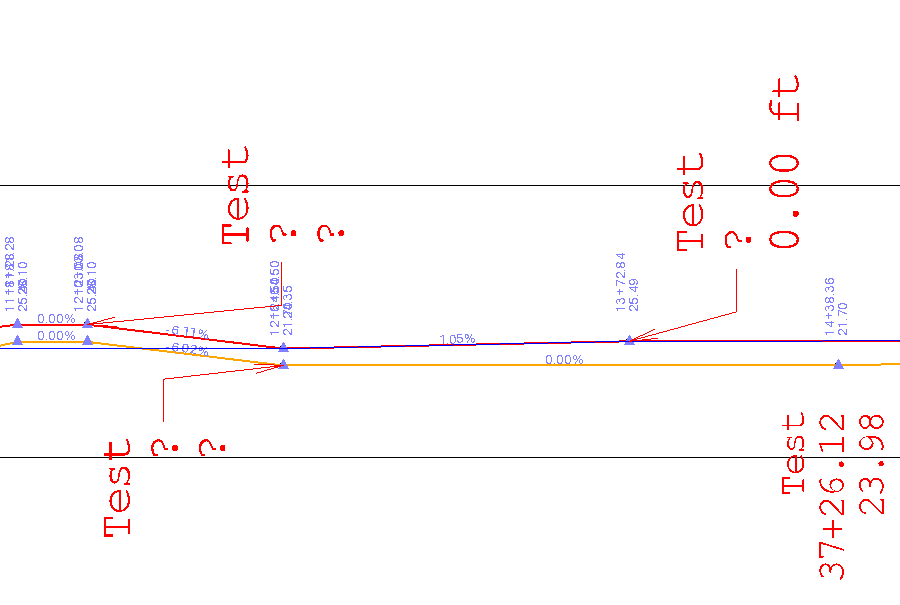
This gave that bottom right test text, but the issue is that one is labeling the red line’s last station instead of the orange line at station 14+38.36. In theory part of this issue is that the orange line has connection to the horizontal alignment of the red one, but the Leader point still reads exactly what I need. Testing this same setup for the red line results in the same last station issue. I’ve also tested using the vertical alignment as reference, but that results as question marks instead.