Volumes Manager

Command Licensing and Default Menu Location
- The Volumes Manager command is part of the RPS Modeling Toolbox
- The command is located on the Smart Suite and Reporting macros menu ribbon
- The command is located in the Reports menu group
Command Description
Create and manage boundaries, boundary collections and boundary groups. Compute and store surface to surface, stockpile and progress volume calculations for later recall. Label and annotate drawings with volume labels and tables and generate formatted volume reports in Excel or PDF for a variety of volumetric scenarios e.g. Stockpiles, Progress, Cut / Fill, Pay Quantities etc.
Command Training Videos
The following video shows how to utilize the Volumes Manager command for normal surface and stockpile volume calculations.
The following video shows how to use the Volumes Manager command to measure and report progress volumes between an initial surface, a final surface and a growing number of intermediary work in progress surfaces.
Latest Updates
July 2025
Version 2025.3 of RPS All Tools introduces progress volumes to the command. You can now select an Initial / Existing surface, a Final / Design surface and multiple Work In progress surfaces, multiple boundary areas and compute all of the surface to surface volumes to monitor progress over time. Improved the volume tables and reports by adding the ability to enable / disable area reporting. Added the ability to report average thickness for large fill operations being brought up in lifts. Improved the Excel reports through connection to the Excel template, and improved results pane layout for more structured result recall. Added Rock Grips button to facilitate easy editing / movement of volume tables in project graphics areas.
March 2023
Version 5.80 of the command (the first release).
Command Interface Description
The Volumes Manager command dialog looks as follows

The command interface has multiple tabs that split up the workflow into 5 steps, you can jump to any tab at any time to update, change or modify the details. The tabs are structured as follows
Materials Tab
The volumes manager uses materials defined by the Materials and Site Improvement (MSI) Manager for its reporting for each boundary. In this tab you can see all of the Materials that are available in the MSI Manager. If you wish to add more materials you can run the MSI Manager from the command header bar.
MSI Manager Command Icon looks like this ![]()
The Materials tab of the Volumes Manager looks as follows

There is currently no user interaction in this tab, it is for information only.
Boundaries Tab
The volumes manager command will compute and report surface to surface, stockpile and progress volume calculations, and will subdivide the results generated based on selected boundaries. The boundaries for a project can be managed in this tab of the Volumes Manager.
You can also run the volume calculation using the No Boundaries option. A Group called No Boundaries is created in every TBC project, select that as your boundary group if you want to compute a volume without boundaries.
You can also run the volume calculation using the All Boundaries option. A Group called All Boundaries is created in every TBC project, combining all of the boundaries that you have defined within the command.
The command introduces the concept of Boundaries and Boundary Collections. A Boundary can be a single closed polygon (2D or 3D) that creates an area within which the volumes will be computed. A Boundary Collection is a set of boundaries that all contain the same material that are defined as a single entity in the Boundary Manager. Once defined and selected in a volume calculation, each individual boundary area will be reported, whether it is defined as a single line boundary or a collection of boundaries.
To keep the boundary list concise, we recommend that where a number of boundaries in a specific location or on a specific project have the same material assigned to them, that they are created as a Boundary Collection vs individual boundaries.
A boundary or boundary collection can only be deleted when it is not being used in a volume calculation or a volume result. Once it has been used in a calculation or a result, it is protected until those calculations or results are deleted. Deleting a boundary or boundary collection that has been used will require that you delete the Volume result, then the volume calculation, then the Group and then the boundary or boundary collection.
For reporting purposes, boundaries / boundary collections can be grouped together using the Group function (see later).
For example, you have a project / site that has an Asphalt Batch Plant and a Concrete Batch Plant. Each Plant has a stockyard that contains the materials used for the batch process. The materials are in piles - each pile containing a specified material. There may be a single pile for each material or multiple piles of the same material at each plant stockyard. In addition, the project may have additional locations on site where there are stockpiles of material e.g. aggregate, sand, gravel, rip rap that you also want to measure. On your final stockpile report for the project, you want to see the volumes for each pile, but you want the piles grouped together first by location (Asphalt Plant, Concrete Plant, Other Stocks) and then within each Group you want the piles sorted by Material type.
The piles can all be individually defined so that every pile has its own boundary record. If at the Asphalt Plant or Concrete Plant there were two or more piles of the same material they can be defined as a Boundary Collection. The Grouping function then allows you to define a group called Asphalt Plant Stocks that groups together all of the piles in that location, a second group called Concrete Plant that groups together all of the materials in that location, and then a third Group called Other Stocks that groups together all; of the remaining stockpiles on the Project.
When reported out by Group (see later) the report structure will be as follows
Asphalt Plant
    Material 1
           Pile 1
           Pile 2
           Pile 3
           Totals

    Material 2
           Pile 4
           Pile 5
           Pile 6
           Totals

    Material 3
           Pile 7
Concrete Plant
     Material 1
            Pile 8
            Pile 9
            Totals

    Material 2
            Pile 10
            Pile 11
            Totals
Other Stocks
     Material 1
            Pile 12
            Pile 13
            Totals

    Material 2
            Pile 14
            Pile 15
            Totals
You can elect to report out by Group or by Material or by Both (2 reports) for each volume calculation.
The boundaries tab of the Volumes Manager looks as follows

To create a new Boundary or Boundary Collection click the ![]() icon below the boundary list.
icon below the boundary list.
Th Delete a boundary or Boundary Collection, select the item in the boundary list and then click the ![]() button
button
When you create a new boundary or boundary collection, or when you select a boundary or boundary collection in the list, it’s properties are listed in the Boundary properties area described below. You can change or add the properties in this area of the dialog.
Boundary Properties
Name:
This is the name that will be used on the reports that are generated using the command. Currently the name has to be entered manually, regardless of the name of the boundary object(s) that you have selected. The reason for this is that if you are creating a Boundary Collection of several boundaries, the name cannot be derived from the source line names, so the field is manually updated at this time).
Description:
Enter a user defined description that supplements the name of the Boundary or Boundary Collection.
Boundary Type:
Select the boundary type for the boundary / boundary collection. The options are Earthworks, Stockpile and Other. Currently this property of a boundary has limited use, that will be expanded in a future update of the command. For Earthworks or Progress volume calculations select the Earthworks type. For Stockpile volume calculations select the Stockpile type.
A Stockpile Boundary type can be used with either a single surface or a pair of surfaces to determine the volumes of the stockpile(s).
An Earthworks Boundary type can be used with two surfaces to compute the earthworks volumes between the two surfaces or the progress volumes between multiple surfaces.
The Other type is there for a scenario where the volume being computed is neither a Stockpile or an Earthworks volume calculation. The Other type requires two surfaces for the volume calculation. At this time the Other type is identical to an Earthworks type boundary or boundary collection, it has a minor influence on the volume reports that are generated.
Material:
Select the Material for the boundary area(s) from the list of Materials presented. If the required Material is not in the list, utilize the Materials and Site Improvement Manager to create it, or select the None - Unclassified option.
Boundary lines:
Select the boundary line or lines that you wish to use for the Boundary or Boundary Collection. You can use the Options button to access the advanced selection modes as usual. The only difference between a Boundary and Boundary Collection, is that a Boundary Collection contains two or more boundary lines.
Save:
Press the Save button to save the data entered and update the Boundary List.
Groups Tab
A volume calculation e.g. for an Earthworks Volume calculation between two surfaces may use one or more boundaries / boundary collections for the computations. The boundaries / boundary collections that will be used for a calculation are put into Groups and the calculation is assigned one or more groups for reporting purposes (see above stockpile example).
Note for every TBC project, 2 groups are created by default - one that includes all of the defined boundaries (All Boundaries) and one that contains no boundaries (No Boundaries). If you wish to compute the volume between two surfaces without any boundaries, select the No Boundaries Group when defining the volume calculation.
Note that if you utilize the same boundary in different boundary collections or you use the same boundary in multiple Groups, then that boundary when reported will contain erroneous volumes in the tables and reports that are generated. You should not use the same boundary more than once in any volume calculation.
The Group Tab dialog looks as follows

To create a new Group click the ![]() button
button
To Edit a Group click the ![]() button
button
To Delete a Group click the ![]() button
button
The Group has some properties that are displayed in the Group properties pane.
Group Properties
Name:
This is the name that will be used on the reports that are generated using the command.
Description:
Enter a user defined description that supplements the name of the Group.
Create / Edit a Group
When you create or Edit a Group a pop up dialog will be displayed as follows

Name:
Enter the name of the group that you want to create
Boundary / Boundary Collection Selection:
On the left side of the dialog you will see a list of Unused (available) boundaries and boundary collections that can be added to the Group.
On the right side of the dialog you will see a list of Group boundaries i.e. Boundaries and Boundary Collections that have been added to the group already.
When no boundaries have been selected you will see the No Boundaries on the right side. When you add a boundary / boundary collection or multiple boundaries / boundary collections to the group, the No Boundaries will return to the left side and the selected boundaries / boundary collections will move to the right side of the dialog.
Right Arrow:
Select the boundaries and boundary collections on the left side that you wish to add to the Group and click the Right Arrow button to move them into the Group boundaries section.
Left Arrow:
Select the boundaries and boundary collections on the right side that you wish to remove from the Group boundaries area and click the Left Arrow button to move them back into the Unused boundaries section.
Volumes Tab
You can create and store as many volume calculations in the project as needed. Each volume that is computed creates a Result in the Result Tab. Within a Volume Calculation, you can compute as many Volume Results as needed over time i.e. if surfaces are changing or being updated weekly, you can use the same volume calculation with either the same (but updated surfaces) and the same (but updated Boundary Group) or with different Surfaces and or Boundary Group. This is especially useful when running the progress volume option.
A single volume calculation will generate a single set of results tables in the graphics view which will be updated with each new result that you generate. The tables are drawn on a user defined layer, each boundary has its own result table and a master table is drawn at a defined location that summarizes the results for all boundaries used in the calculations. If you require multiple result tables - one for each result calculation, you can generate the master results table for any result computation from the Results Tab.
For example, on a project you are surveying the site once per week for the determination of progress volumes. You can either have one volume calculation called Progress Volumes and within that have many separate results (one for each weekly survey) or you can have Multiple volume calculations, one for each weekly survey. The first method nests the weekly results under one volume calculation, the second method creates each volume calculation as a separate line item within the volume calculation. Either approach can be used.
For the same Progress Volume results, the same Boundary Group can be used each week to break the volumes out into Project Phases or Separate Work Areas, or you can change the Boundary Group each week as work areas change on the project etc.
To Create a new volume calculation click the ![]() button. This will open the following dialog
button. This will open the following dialog
Earthworks Volumes

Progress Volumes

Note: Select the progress surfaces in the Intermediate surfaces section using the ![]() button. This will open up the surface selector dialog below
button. This will open up the surface selector dialog below

From here select the surfaces using CTRL and Click on the left, select them in the order in which they were measured, and then click the Right arrow button to select them as volume surfaces. If you select them in the wrong order here you can change the order of the surfaces in the previous dialog when you close this dialog.

Type:
Select the type of volume calculation - Earthworks, In progress of Stockpile, the dialog will change depending on the option selected.
Name:
Enter a name for the volume calculation
Description:
Enter a description for the volume calculation
Initial surface:
Select the Initial surface for the calculations. In progress volumes, this should be the starting surface before any construction has taken place. The command computes the total volume for the process between the initial and final surfaces selected, it then computes the volumes as sequential or cumulative depending on the options below.
Intermediate surfaces:
Use the ![]() button to add intermediate surfaces.
button to add intermediate surfaces.
Once added you can order the surfaces here using the up / down arrow buttons ![]() .
.
You can select a surface in the list and delete it using the ![]() button.
button.
Note: when you want to add more surfaces at a later date to carry out another volume calculation, come back to this point by editing the volume calculation and add more surfaces as necessary.
Final surface:
Select the final surface (typically the design surface) here for the total expected volume calculations and also to facilitate % progress and % to completion numbers for each set of calculations. The Final - Initial volume sets the cut / fill target for the overall process, the intermediate surfaces provide the interim calculations and the % Completed and % Remaining numbers to track progress at each survey.
Sequential Volumes:
If you have the Initial (Existing), Final (Design) and then interim surfaces S1, S2, S3, S4 measured between Initial and final surfaces, the sequential calculations are as follows
Initial to S1
S1 to S2
S2 to S3
S3 to S4
S4 to Final
Note: This method will pick up and count double movements of material that happen between the measurement dates, that can be seen by the surface models. This method can end up reporting unexpected volume movements as a result.
If you require average lift thickness to be computed and reported, you must use the Sequential method and select Report Areas = Y later in the dialog.
Cumulative Volumes:
With the same scenario as above, the cumulative calculations are as follows
Initial to S1
Initial to S2
Initial to S3
Initial to S4
Initial to Final
Note: This method only shows the net volume movement over each time period from the start of the project to that date and time. In this case, double movements of material are omitted over time and provide the “expected” volume results, however they do not tell the whole story and you may be moving materials multiple times and not see that in the overall results.
If you select this method, you will not be able to report Average Lift Thickness results.
Calculation method:
You can choose the calculation method that you wish to use - Takeoff (Grid Volumes), 3D Model -Normal TIN, or 3D Model - point cloud tin.
Takeoff:
This utilizes the grid volumes method. When selected enter the grid size that you wish to use for the calculations. Grid volumes, even with a small grid size are significantly faster than tin model calculations for the same source surfaces. Grid volume results will typically yield almost identical results to the TIN based methods. Remember that large grid sizes introduce more smoothing, however the pluses on one side typically balance the minuses on the other side so the net result will be the same.
3D Model - Normal TIN:
This utilizes the traditional surface to surface volume calculation between two triangle surfaces. It utilizes the “Track All Triangles” project setting found in Project Settings - Computations - Surface. This is the most precise volume calculation method.
3D Model - Point Cloud TIN:
This utilizes the traditional surface to surface volume calculation between two triangle surfaces. It utilizes the “Do Not Track Breaklines” project setting found in Project Settings - Computations - Surface. This is a calculation method suited to volumes between surfaces derived from point cloud data, where there are no breaklines in the surface models. This method is ~30% faster than the Normal TIN method for the same data.
Volume Groups:
Select your boundary group(s) that you wish to use for the volume calculations. The boundary groups and the boundaries / boundary collections that they contain are used to organize the final result tables and reports that are generated.
OK:
Click OK to accept the settings and proceed to the volume calculations.
Cancel:
Click cancel to exit the dialog without saving the changes made.
Stockpile Volumes

To Edit a volume calculation, select the volume calculation in the list of volume calculations and then click the ![]() button. Note when you are running progress volume reports, when you first create the volume calculation, you will select the Initial and final surfaces plus a number of work in progress surfaces (e.g. lifts 1, 2, and 3). When you have completed e.g. Lifts 4, 5 and 6 you can edit the volume calculation and add the additional progress surfaces to the computations.
button. Note when you are running progress volume reports, when you first create the volume calculation, you will select the Initial and final surfaces plus a number of work in progress surfaces (e.g. lifts 1, 2, and 3). When you have completed e.g. Lifts 4, 5 and 6 you can edit the volume calculation and add the additional progress surfaces to the computations.
To Delete a volume calculation, select the volume calculation in the list of volume calculations and then click the ![]() button
button
Volume Properties
Each volume calculation has a set of properties that are displayed in the Volume properties pane. When you select a volume calculation in the list, the volume properties for that calculation are displayed in the volume properties area of the dialog. The properties reflect the current / last used properties of the calculation and will update with each new result calculation that is computed.
Name:
Name the Volume Calculation. This name will create a new Volume Calculation with a single or multiple volume calculations within it. The name will appear in the pull down list of volume calculations currently available within volumes manager, at the top of the Volumes tab in volumes manager.
Description:
Provide a Description of the Volume Calculation that supplements the Name of the Volume Calculation. This is Optional.
Type:
Select the type of Volume Calculation.
Each volume calculation has a Type of computation. the options are currently Earthworks, Progress or Stockpile volume.
An Earthworks Volume requires two surfaces and a Boundary Group (or Boundary Groups).
A Progress Volume requires an Initial / Existing surface, a Final / Design surface and a selection of intermediary / work in progress surfaces and a Boundary Group or Groups.
A Stockpile Volume requires either a single surface or two surfaces and a Boundary Group (or Boundary Groups).
Initial Surface:
Select the initial surface from the pull down list of surfaces. For Stockpile volumes this surface is optional. The initial surface would be e.g. the Existing Ground surface (For Progress Volumes), the Stockyard Base Surface (for Stockpile Volumes), or the Initial State surface for Earthwork Volumes.
Final Surface:
Select the Final surface from the pull down list of surfaces. The Final surface would be e.g. the Final Design surface (For Progress Volumes), the Stockpile surface(s) (for Stockpile Volumes), or the Final State surface for Earthwork Volumes.
Compute new result
A volume calculation can be used many times to generate a new result. Each result updates the result tab. when you enter a new Title for a new result, you will be given the option to “Compute new result”.
A Volume Calculation Result has the following elements
Title:
The Title is used in the results tables and on the reports that are generated. Enter a Title.
*Notes:
You can add notes to a volume result. The notes will appear in the footers of the result tables in graphics and in the reports that are generated.
Draw results table checkbox:
The results table is the master summary report table that is drawn in the TBC graphics. Check this checkbox if you want to create the results table in your drawings.

Draw boundary tables checkbox:
The boundary tables are a summary table that is created beside each of the boundary lines used in the computations. Check this checkbox if you want to create the boundary tables in your drawings.

Report by material checkbox:
The reports that get generated and the results table will organize the data by either Material or by Group (and then by Material). If you wish to report the volume calculations sorted only by Material check this checkbox. The output using this method will report as follows

Note: If you check both the Report by material and Report by group checkboxes, you will get two reports in one, the volumes will be duplicated as a result. We recommend selecting only one of these two options.
Note: Report by material is not an option for Progress Volume calculations.
Report by group checkbox:
If you wish to report by Group (and then by Material) check this checkbox. The output using this method will report as follows

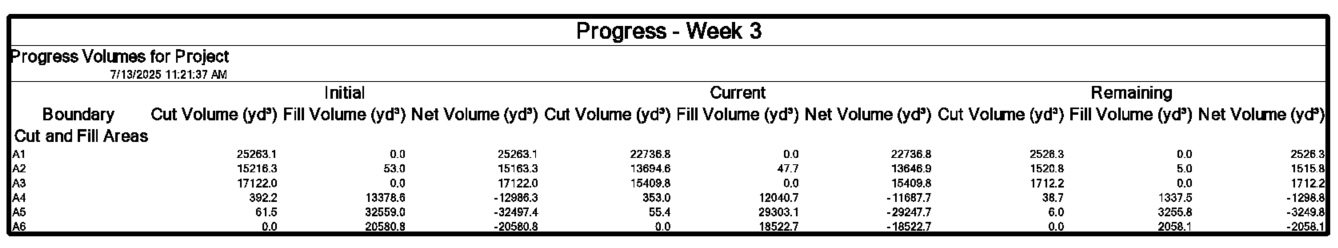
Summary Progress Volumes Table Example
The following is an example of a Progress Volume Summary Table as placed in the Plan View graphics.
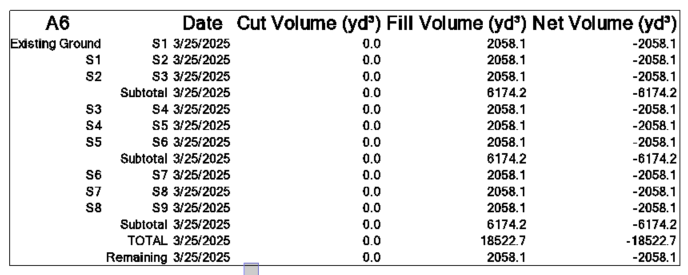
Boundary Volumes Table Example
The following is an example of a Progress Boundary Volume Table as placed in the Plan View graphics.
Save Isopach’s checkbox:
An isopach is a difference model derived from the computation of volumes between two surfaces or a single surface with boundaries. The isopach’s have a 0 datum and positive (areas of fill) or negative areas (areas of cut). The isopach’s are displayed with elevation colors that are derived from Project Settings - Computations - Surface as shown below

Each volume calculation creates an isopach for each boundary area used in the calculation. The Isopach’s are replaced with each new result that is created. The Isopach’s currently in existence for a volume calculation, like the result tables are for the last result that was executed within that volume calculation.
If you want to label the Isopach’s with Cut Fill labels, use the Create Surface Elevation Grid command from the Surface menu to achieve that.

Show areas checkbox:
If you wish to display the surface areas for cut and fill areas in the reports and graphical tables, check this checkbox. Note that if you want to display the average layer thickness for progress volumes (layered lift tracking), you need to also enable areas here.
Table origin:
Select a location in the graphics view where you want to place the Results table.
Tables layer:
Select the layer on which you want this volume calculation results tables to be drawn. Note that each Volume Calculation’s tables should be drawn in a different location and or layer to avoid overlapping text for drawing creation. You can create a new layer and layer group using the new layer control and filter control as per other RPS commands.
Refresh reports and tables button:
If you select a new table origin, or change any of the settings and wish to refresh the graphics drawing elements with that new location, or if you wish to reset the default locations and content for the tables in your drawing, click this button. Note that clicking this button does not refresh the volume calculations, to do that create a new result, so that prior results can be retained for reference. If a prior result is not required, it can be deleted.
Compute new result button:
if you wish to compute a new result for the volume calculation, you can enter a new title, notes and set the checkboxes as required and then click the compute new result button to execute. The new result will update the drawing tables, the isopach’s and the results area of the dialog.
Last result:
Once the volume calculation has been computed, the Last result area of the dialog will be populated with the volume report that echoes the drawing tables that are placed in the graphics area.

The data in this area is in a tabular format, if you wish to copy and paste the information into e.g. Microsoft Word or Excel you can do that from here directly. All formatting and layout is carried via the Copy / Paste function. Use CTRL C to Copy the selected data and then use CTRL V in Word or Excel to Past the information into the document or spreadsheet. Note that there is a full Excel and PDF export in the Results Tab (see below)

Save:
Click Save to save any calculation results or changes that you make. Note that all changes are automatically saved when you close the command or move between Tabs of the command.
Rock Grips:
When running normal TBC commands, you cannot access the Grips on objects in the graphics while a command is running, The Rock Grips button enables you to access the grips on TBC objects while the Volumes Manager command is running. For example, when the boundary tables are placed in graphics, they are automatically located at the the top NE corner of the boundary that they reference, if you want to relocate the table, click Rock Grips button and then select the lower left corner of the table boundary using CTRL and Left Click to drag the boundary to where you want to place it and then release it. Then click the Refresh reports and tables and the content of the table will be moved to the new table location.
Results Tab
As described in the previous section, a volume calculation can be defined once and then used to compute many results over time using updated or different source data. Each result that is computed is stored with the volume calculation and can be recalled in the results tab.
The results tab dialog looks as follows

Volume
Select the Volume Calculation containing the results that you wish to review. Once selected, the results that have been computed for that volume calculation are displayed in the table below. Each result carries the Date and Time that the result was computed along with the Title of the volume result. You can then click on a specific result in the list to review all of the information about that result.
To delete a computed result, select the result in the list and click the ![]() button.
button.
Export Excel
When a volume result has been selected in the list of results, click the Export Excel button to export the results to Microsoft Excel. The report that is generated is a fully formatted report.
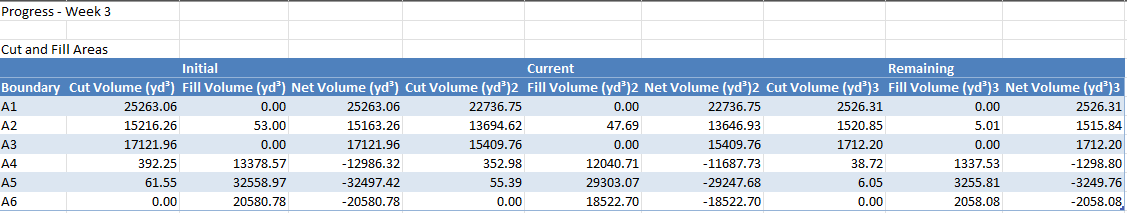
Summary Tab Output
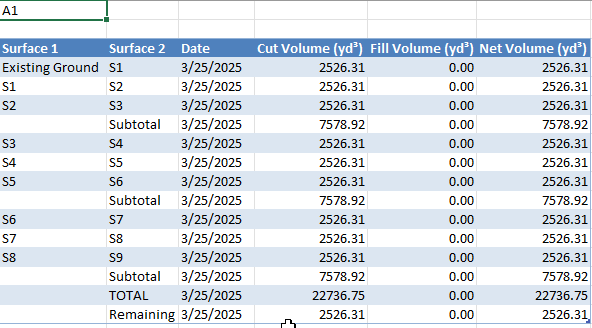
Area Tab Output
Example Report Download
Week 3 Volumes.xlsx (15.0 KB)
Export PDF
When a volume result has been selected in the list of results, click the Print report button to print the report and select a Print to PDF driver if you want to write the file to a PDF file. The report that is generated is a fully formatted report.

Example Report Download
Volume report.pdf (90.1 KB)
Report options
The report options are inherited from the settings defined for the volume calculation result. If you wish to change the location of the tables or the method that the results will be displayed (by Material or by Group) in graphics or in the reports, you can modify the settings, define a new origin location and layer for the updated tables and then click the Add Tables button. This allows you to create tables for older results should you need those in addition to the “latest result”.
The report information for the selected result is displayed in the report area.
Save
Click the Save button to save any updated information or settings for the selected result.
Command Tips
This area of the dialog can be minimized using the orange arrow in the top left hand corner of the command tips pane. The command tips pane contains useful help information relating to the command and any hotkey shortcuts that can be used while running the command.
Command Header Tools
In the header area of the command pane, you can find quick access command icons for commands that may be useful to you while running the volumes manager command. For this command these include
- RPS Help
- RPS Settings
- PDF Manager
- CAD Cleanup
- Smart Select
- Smart Draw
- Smart Edit
- Smart Elevate
- Smart Model
- Move
- Materials and site improvement (MSI) manager
- Create boundary
- Grid Volumes by Boundary
Switch cmd button
The switch command button provides the ability to Close the current command, Close All running commands, or switch to another command that is already running. You can also access the Switch cmd dialog by pressing the ESC key on your keyboard, this pulls up the Switch cmd list right by your current cursor position. Pressing ESC key twic will also close the current command.
Use Case Videos
The following videos show the use of the Volumes Manager command in a work process context
Feedback and Enhancement Requests
If you would like to provide feedback on the use of the Volumes Manager command or to request enhancements or improvements to the command please click Reply below.