Hi,
I am trying to replicate a grid volume report style similar to another modeling company in my area that uses Topcon where they have a grid over the site with a simple Cut/Fill indicator in each grid. I want to recreate it in TBC, but using the Volumes Manager provided too much information which clutters up the screen and is difficult to read without viewing inside TBC. I need to be able to print it out on a standard sheet of paper.
All I really need from the report is the cut or fill and the amount.
Any help would be greatly appreciated. Thanks in advance.
Saul
Saul
Until we have a way for you to select the items you want in each Grid Cell Report you can do the following
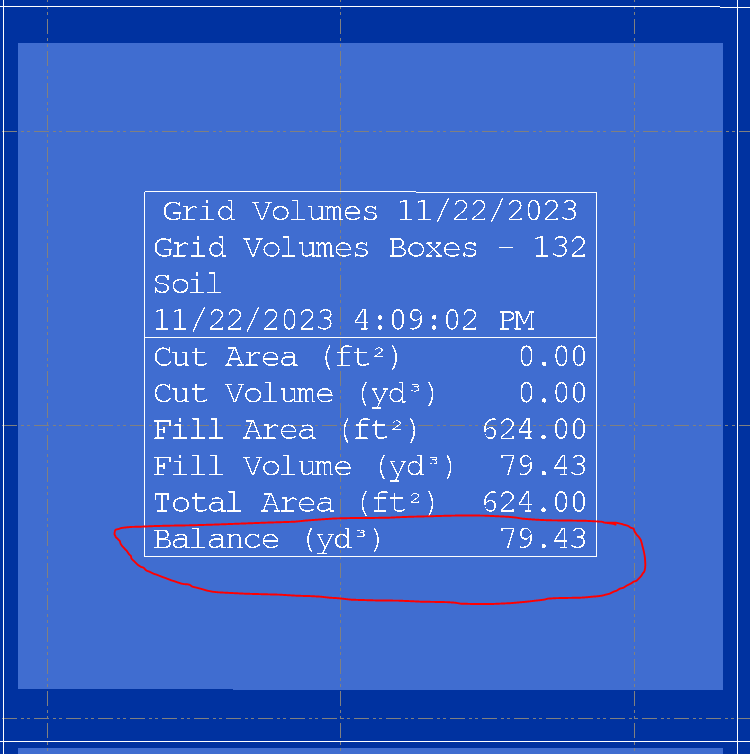
- Use Advanced Select to select all Multiline Text that has the property “Text” that equals Balance (m3) and then Apply and then change the Layer Property of the text selected - that will get the Balance titles on a layer.
- Now use Window Select from Top Left to Bottom Right and make sure that all the Balance Volume Text is inside the window and nothing else - this will select all the Volume Numbers - you can do one row at a time and hold the CTRL key down to group select using this method - then once it is all selected change the layer property of that selected text to the same layer that you put the Balance (m3) or Balance (yd3) text on
Now that you have that on a separate layer you can turn off all other text and then move the Balance text (all of it) from where it is now to the centroid of the Grid Cells
Not a pretty solution I appreciate that but it will get you what you need
Alternatively
If you let Volumes Manager create all of the Isopach Surfaces for each Grid Cell then you can use Smart Text to label up each Grid Cell and reference the Isopach in each Grid Cell as the surface - the Smart Text
Cut = @<OD,O,VC>@
Fill = @<OD,O,VF>@
Net = @<OD,O,VN>@
Will create a label that shows the Volume of Cut, Volume of Fill and Net Volume for the grid cell, if you place all the smart text on one layer and place it at the centroid of the Grid Cell it will look pretty good - you will need to click a fair bit to place one text block in each cell but you can get the result you are looking for.
The smart text has to reference a unique Isopach for each grid cell which can be a lot of surfaces.
We have an action to provide a User Control over the Tables that are auto created by volumes manager - however I cannot say at this stage when we will implement that.
Alan
Hi Alan,
Thanks for taking the time to answer my question. I chose the first method, but ended up using only the +/- volume because the spacing wasn’t quite right. I also used a combination of plot scale and text height to get the sizing I was looking for. When you get a chance, could you please elaborate on the second method?
Thanks again.
Best Regards,
Saul